
London, Frankfurt, 25th November 2019 – big xyt, the independent provider of market data analytics is pleased to announce that it has been named as ‘Editors Choice – Outstanding TCA provider’ at The TRADE Leaders in Trading 2019 Awards. Robin Mess, CEO at big xyt, who collected the award with Mark Montgomery, Head of Strategy and Business Development, at a ceremony in London last week commented, “We are delighted to have received this recognition as Outstanding TCA provider from the Editors at The TRADE and thank our clients and XYTView users for their support this year.” John Brazier, Editor of The TRADE said, “Throughout the year we have heard a lot from the buy-side about the value of TCA to their trading processes, and big xyt was one of the names that was continuously raised in this discourse.” He added, “The TRADE editorial team were impressed with big xyt’s quality of service and high level of dedication to providing the buy-side community with tools they need to achieve best execution and deliver the best returns to clients as possible.”
ondon, Frankfurt, 3rd October 2019 – big xyt, the independent provider of market data analytics, today launched XYT View, a specialist aggregated view of fragmented market information that participants need to ensure that they are achieving the best possible outcomes for themselves and their clients. The company is also pleased to announce that Steve Grob, CEO at Vision 57 and “long time” market commentator will be working with the Strategy team to provide market consultancy and additional thought leadership. XYT View provides a meaningful range of market overview metrics and has been developed to fill the information gap caused by the withdrawal of previous alternatives. Delivered via interactive dashboards, users can observe changes in displayed liquidity, periodic auctions, opening and closing auctions across the entire equity and ETF trading landscape in Europe.
London, Frankfurt, 21 June 2019. big xyt, an independent provider of high-volume market data analytics, is pleased to announce the launch of Consolidated View, an extension of the market analysis metrics available to all members of the investment community from the Liquidity Cockpit platform and 250days website dashboard. The new views allow access to a standardised independent view of the trading activity across the equity and ETF trading landscape in Europe. big xyt clients, including multiple global exchanges and investment banks, have increasingly been using detailed information and analytics from the Liquidity Cockpit as a reference to validate their trading performance to their clients. By allowing complimentary access via 250days.com to the aggregated data for single stocks, regions and indices, this new initiative delivers independent aggregated information, adding a much-needed layer of efficiency and transparency to the market.
London, Frankfurt, 3 June 2019. big xyt, an independent provider of high-volume smart data and data analytics, is pleased to announce that, Liquidnet Europe Limited, have extended their use of the big xyt analytics Liquidity Cockpit platform to monitor execution quality of its products along with cross-checking market volumes. big xyt are providing Liquidnet execution analysts with an interactive application to monitor market information via the Liquidity Cockpit dashboard. By using data science big xyt solutions capture, normalise, collate, and store trade data at a granularity that has not previously been available in the market.
Changing the way data is interrogated and benchmarks viewed London, Frankfurt, 23 April 2019. big xyt, an independent provider of high-volume smart data and data analytics, is pleased to announce that, following consultation with a number of clients, the big xyt analytics platform has been extended to include Transaction Cost Analysis (TCA). It is recognised that post-trade TCA is transitioning from just a compliance solution to being seen as a crucial business function and big xyt is transforming the traditional view of TCA with data science; applying advanced techniques to increase quality and deliver flexible consolidated data views. Whilst TCA benchmarking calculations have not radically changed over the years firms increasingly demand flexibility to benchmark in-house analytics with an independent market source, in a way that better fits their business requirements.

One of largest financial companies and a major provider of institutional banking, investment management and broker services. Long-standing experience of trading electronically in European equities, offering a market-leading suite of algo execution and analysis tools to its clients. The Challenge Although the client was already using a white-labelled transaction cost analysis (TCA) service from another vendor, as a highly sophisticated user of TCA data and analytics, the client required a more detailed understanding of its execution performance than its existing provider was able to deliver. Critically, the incumbent vendor was unable to provide the required levels of transparency on the underlying data and methodology used to generate its TCA reports.
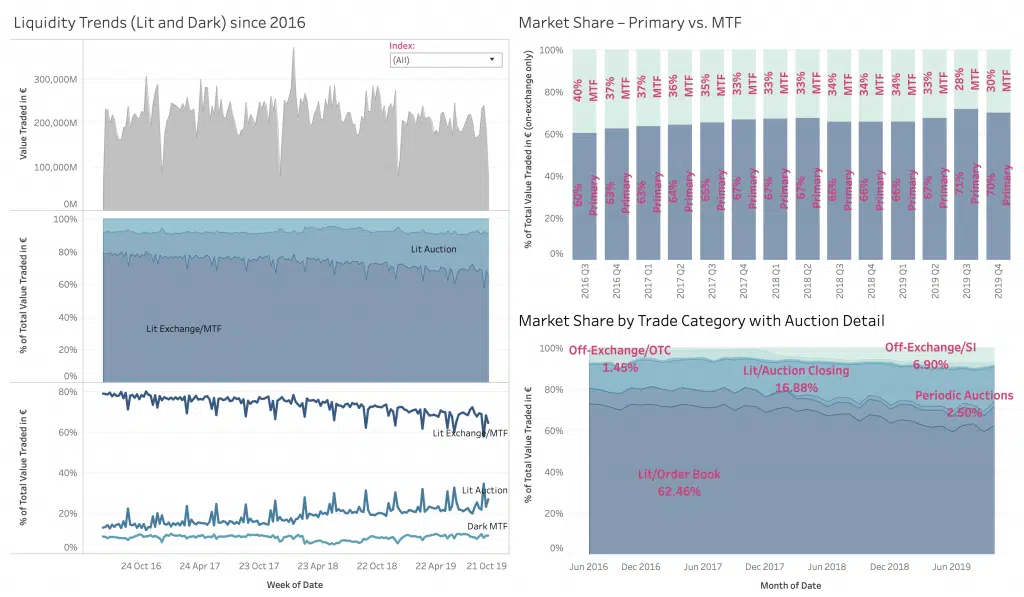
Analysing trading data from multiple points of view one year on from MiFID II London, Frankfurt, 28th January 2019. big xyt, the independent provider of high-volume, smart data and analytics capabilities is pleased to announce the launch of www.250days.com, a collection of views reflecting the evolving market dynamics over the past year. The new site leverages the Liquidity Cockpit, the industry recognised reference for independent market structure analysis, and has been created in response to multiple client requests. Visitors will have access to annotated visual analysis of the fragmented European equity trading landscape leading up to and during 2018.
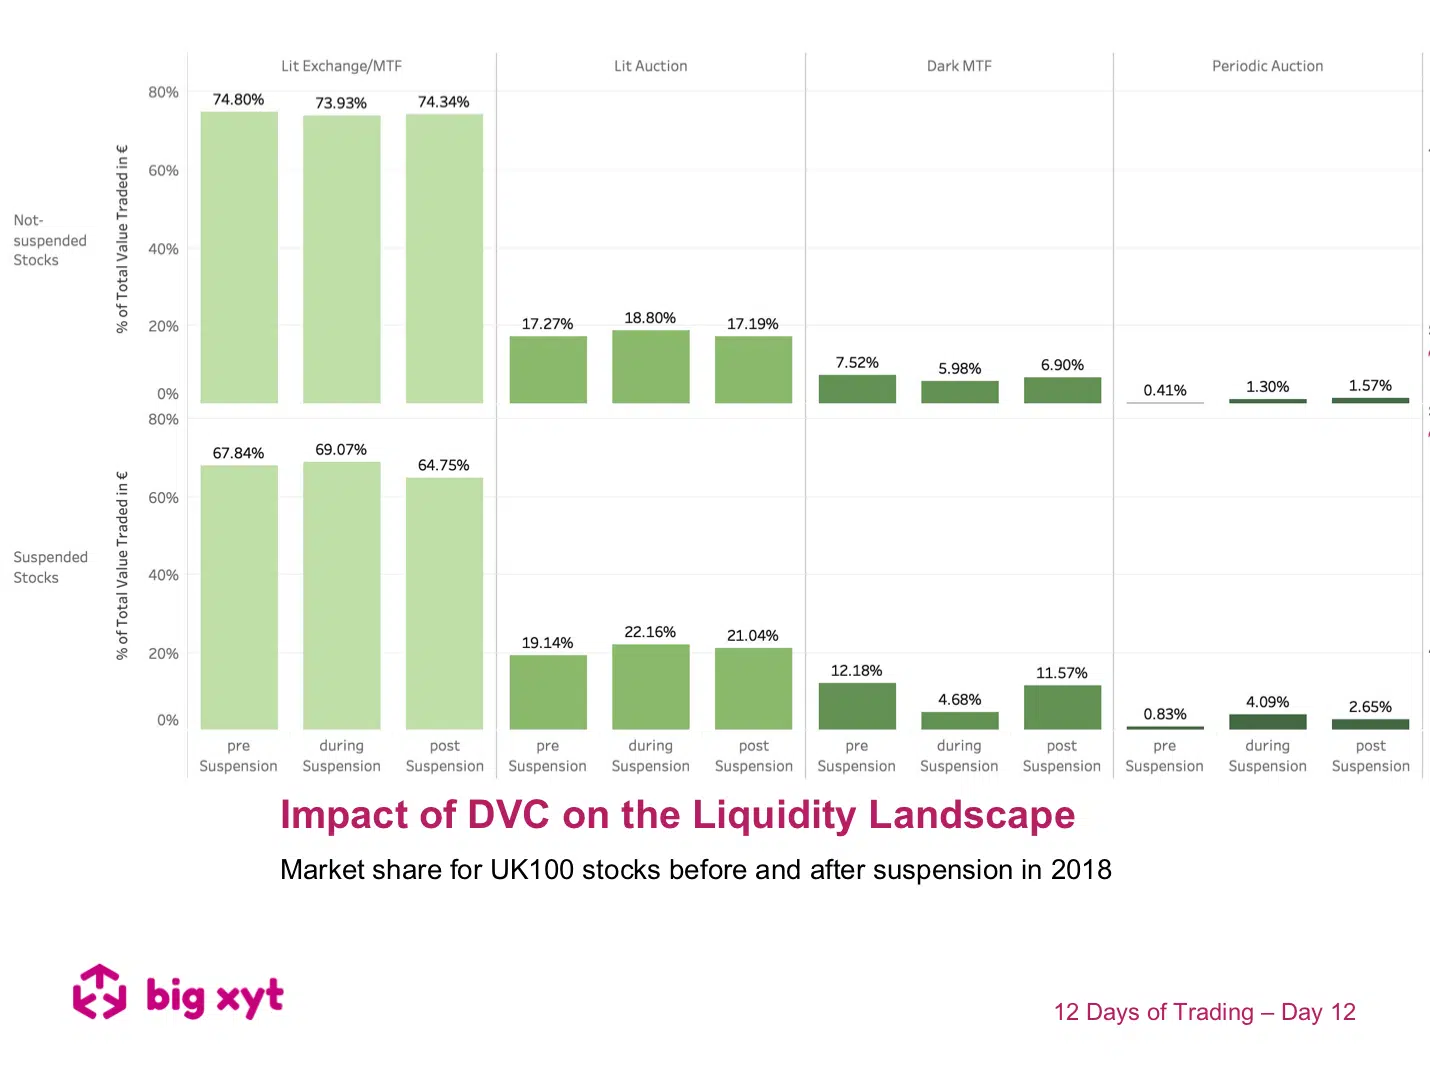
In our final view of the series we return to one of the most controversial MiFID II introductions, Double Volume Caps, with a different attempt to assess their impact by examining how UK blue chip volume dispersed before during and after DVC suspensions. As an explanation for the methodology used for this exercise, in slide one we look at market share before during and after the DVC suspensions. The second slide looks at market share change. The baseline for the calculation is market share before suspension. Some observations: By definition, stocks that were not suspended trade less in the dark and possibly are less liquid in general. Therefore they trade more on Central Limit Order Books and less in Auctions and naturally, Dark Pools. Behavioural change may be in evidence as alternative mechanisms (auctions in particular) appear to maintain and grow their share post-suspension vs pre-suspension.
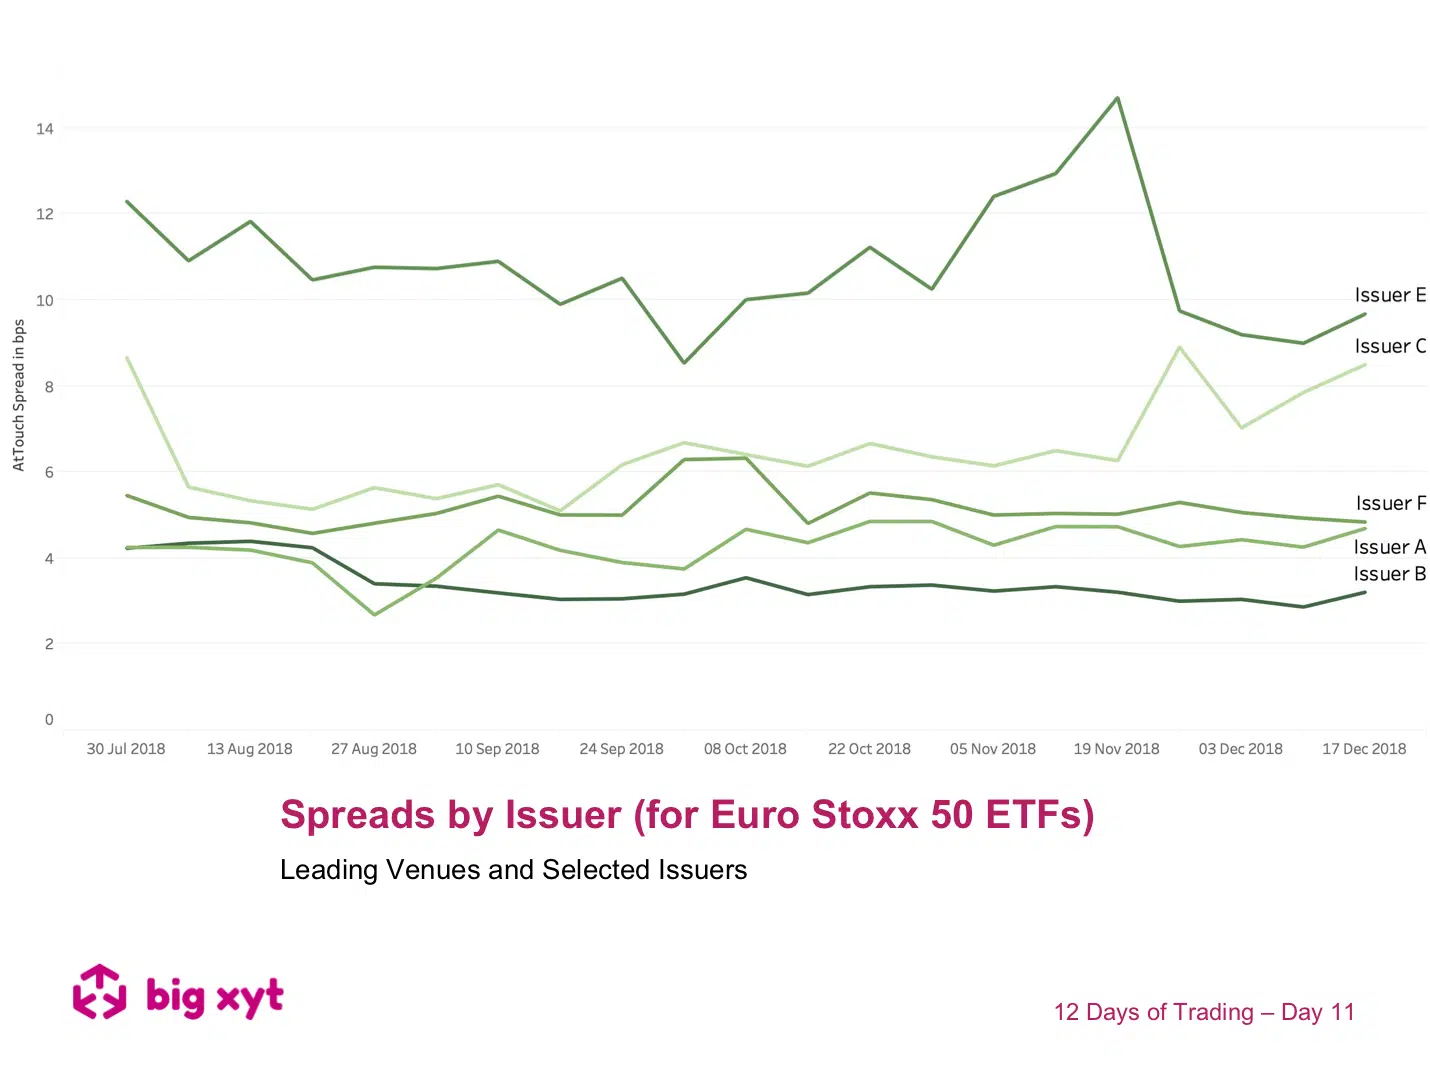
12 Days of Trading – Day 11 of 12: ETF Spreads by Issuer Day 11 of 12: ETF Spreads by Issuer Another comparative way to look at ETF spreads is by issuer. For today’s review the issuer names are anonymised (issuers A to F), but consistent across both charts. In the 2 charts today, we can see the choice facing investors when looking to trade an ETF representing a particular underlying benchmark. Whilst many issuers compete in the same space, there can be quite difference in spreads (& available liquidity) depending on issuer and benchmark.
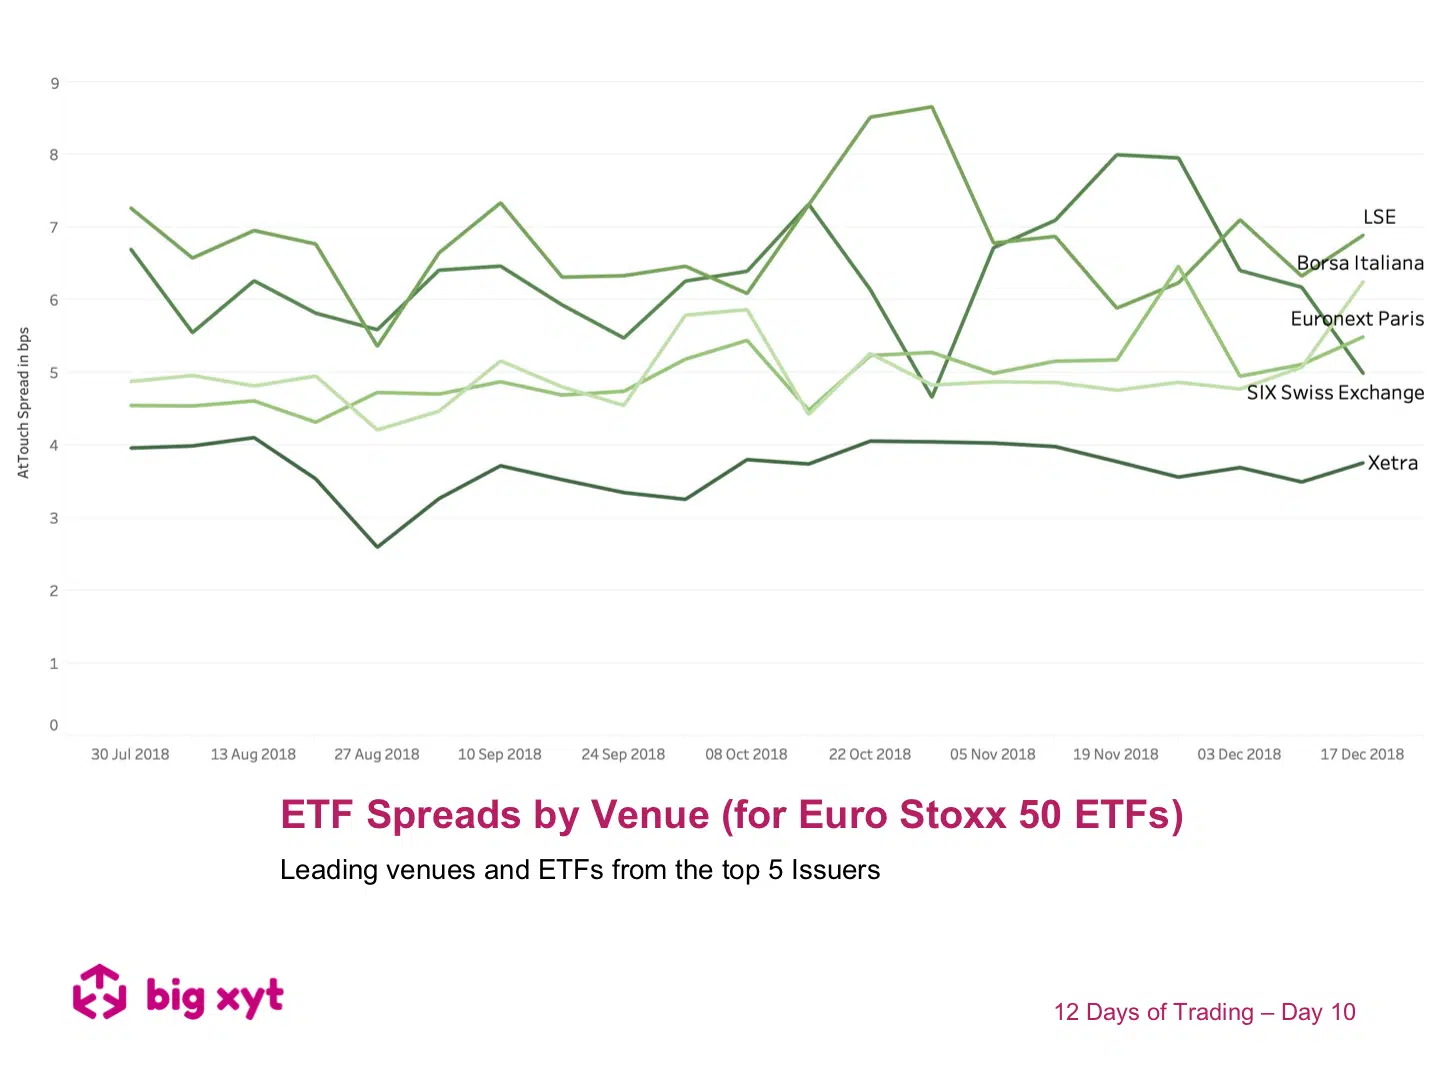
12 Days of Trading – Day 10 of 12: ETF Spreads by Venue Day 10 of 12: ETF Spreads by Venue From our consolidated view of lit markets in ETFs, it is not surprising to see that At Touch Spreads vary by venue. However, looking at the second chart, it would seem wise for the end investor to be aware of where the underlying constituents are quoted. In other words liquidity in ETFs can depend on where they are quoted just as much as the constituents of the underlying basket they are representing.