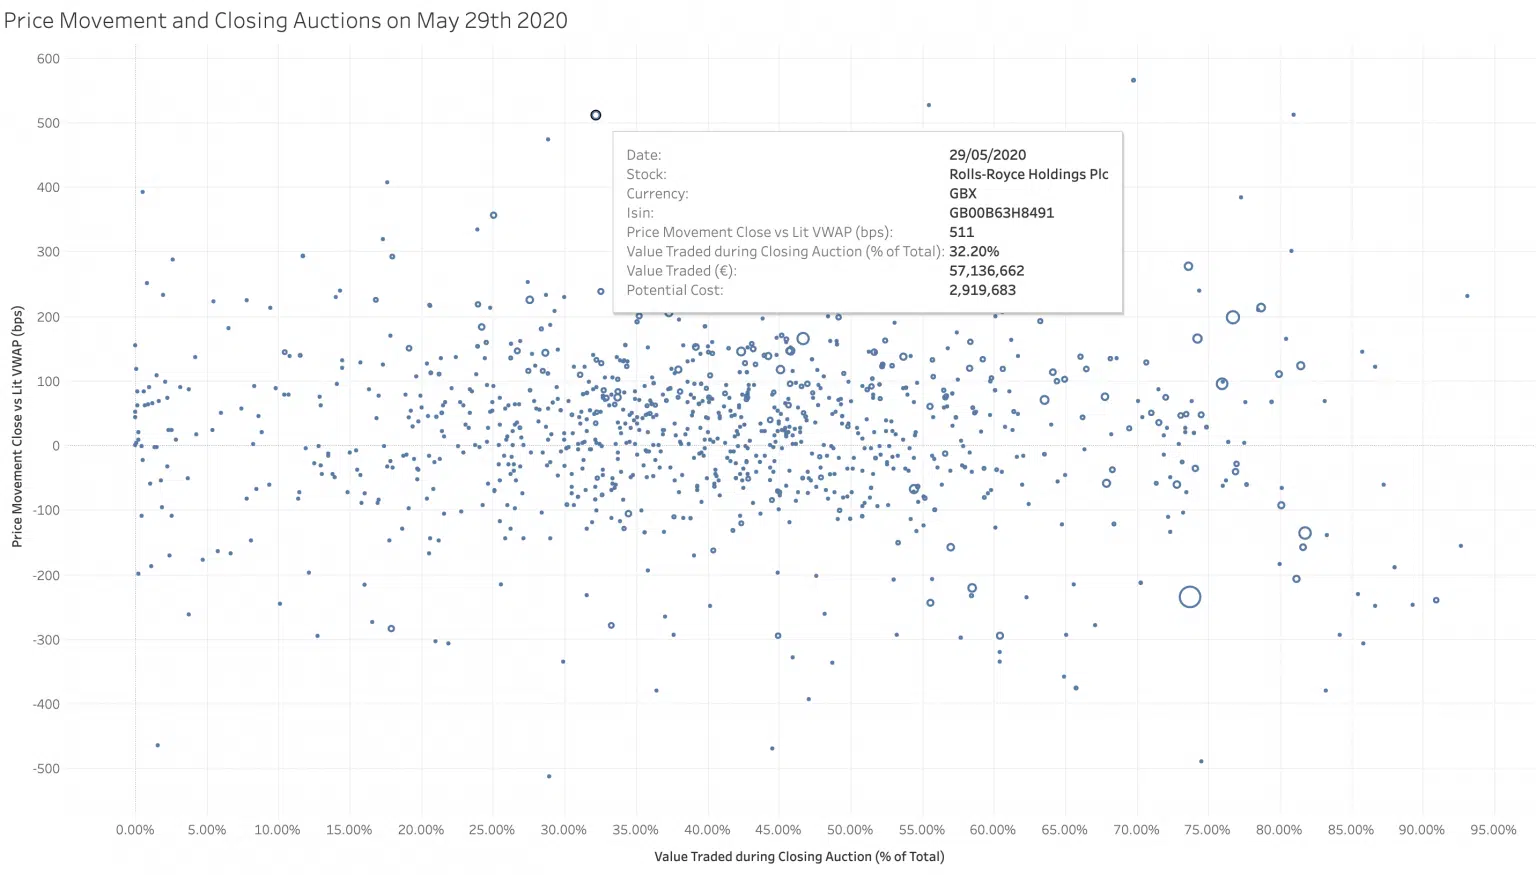
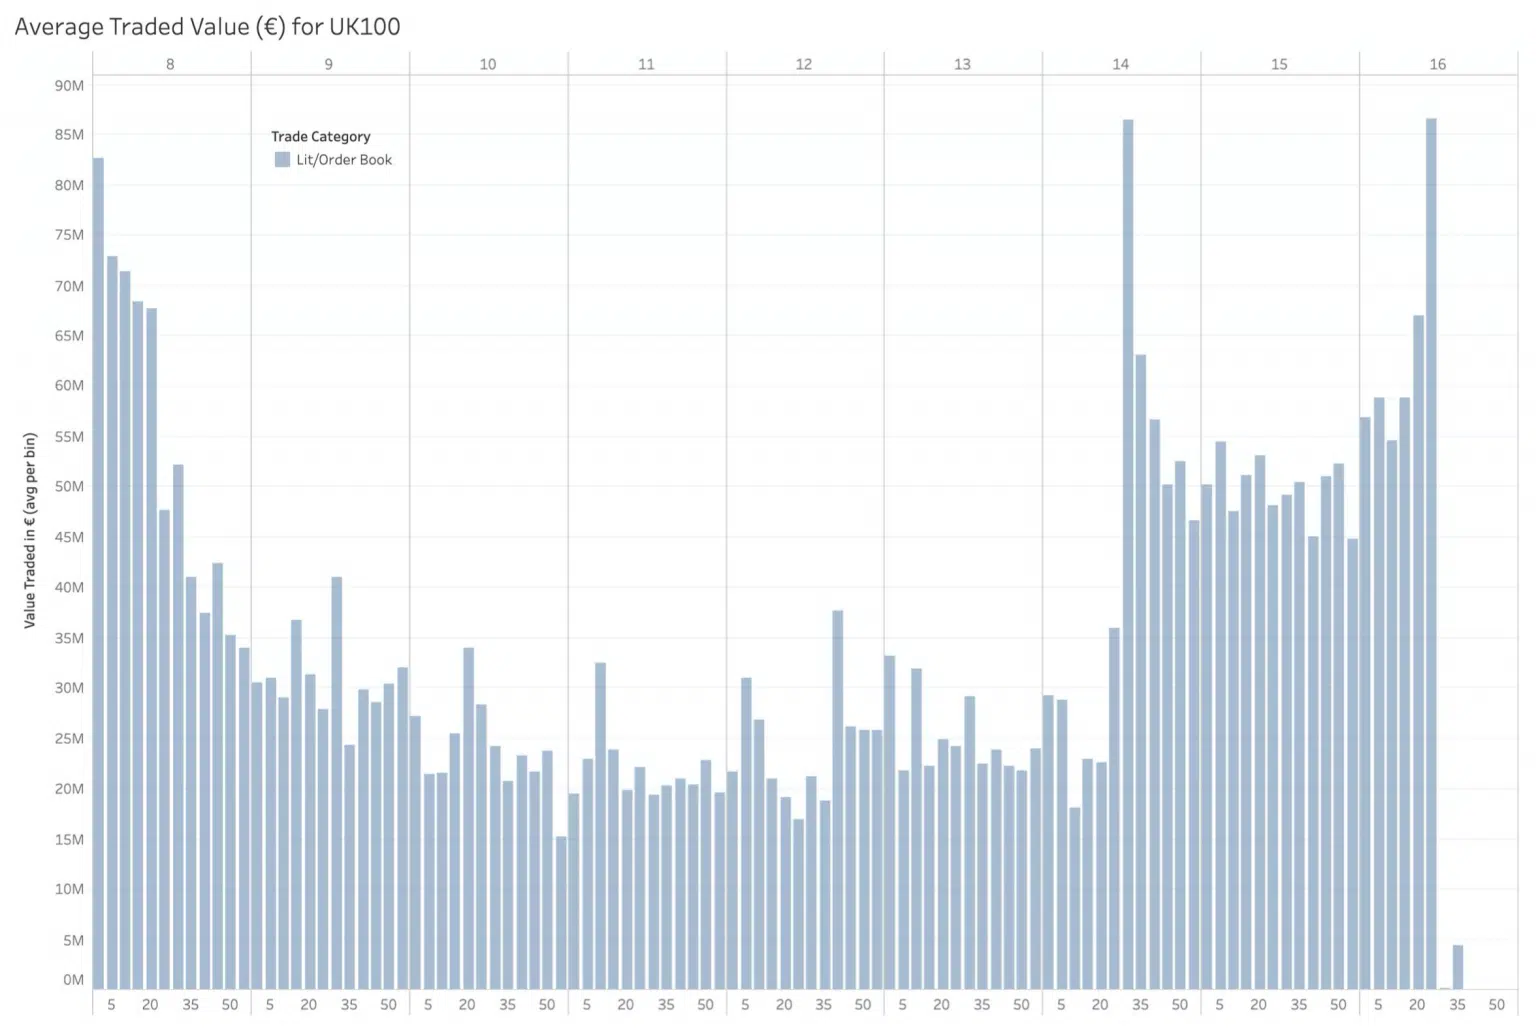
It seems like a good time to leave the days of isolation behind us but fear not, our observations will continue this week. Following on from our previous post, we promised to take a closer look at one of the many outliers from the exceptional closing volumes on 29th May. Rolls Royce struck us as an interesting stand-out (main image above). There was heavy trading ( 32% of the daily turnover) at the close, although as far as we are aware, it was not an index addition or deletion on the day, The value traded was five times larger than the twenty day average closing volume (See chart below).
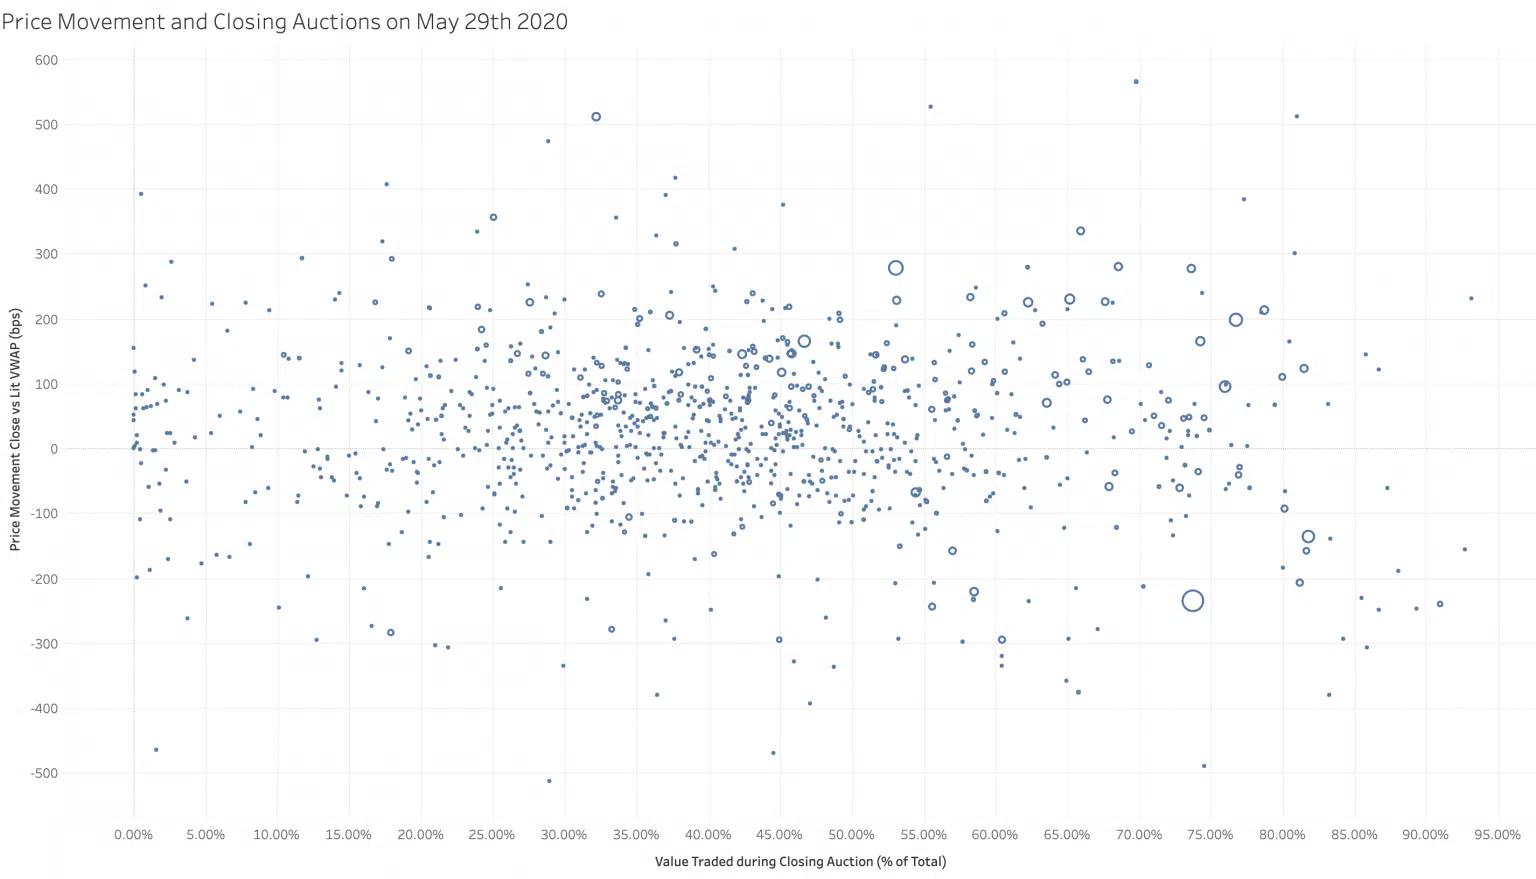
Some of you may have been straining your eyes looking at the night sky during the recent SpaceX launch. The image above isn’t a photographic negative image of heavenly bodies, it is actually a scatterplot of multiple European stocks. The Y-axis measures the difference between lit intra-day VWAP and closing price versus % daily volume traded at the close on the X-axis. An accurate and well maintained granular financial dataset combined with powerful visualisation tools can be like introducing an amateur astronomer to a powerful new telescope. On 29th May, the day of a large index rebalancing trade, we saw significant increases in volumes traded at the close as mentioned in our post last week. Using scatterplots like this we can see the stocks with the largest percentage of their daily volume in the close, combined with another dimension. This measure shows the difference between the closing price and the full day Volume Weighted Average Price (VWAP) excluding the auction print. Stocks that were announced for addition or deletion do not necessarily show the largest price move during the Closing Auction. Many other stocks are more affected both positively & negatively. On average the stocks selected in this pan-European universe saw a closing price deviation of 1%. That means for the €33bn traded in the closing auction that day, there was a total cost or profit of €300mn depending on whether you were on the right or wrong side of the decision to trade in the auction.
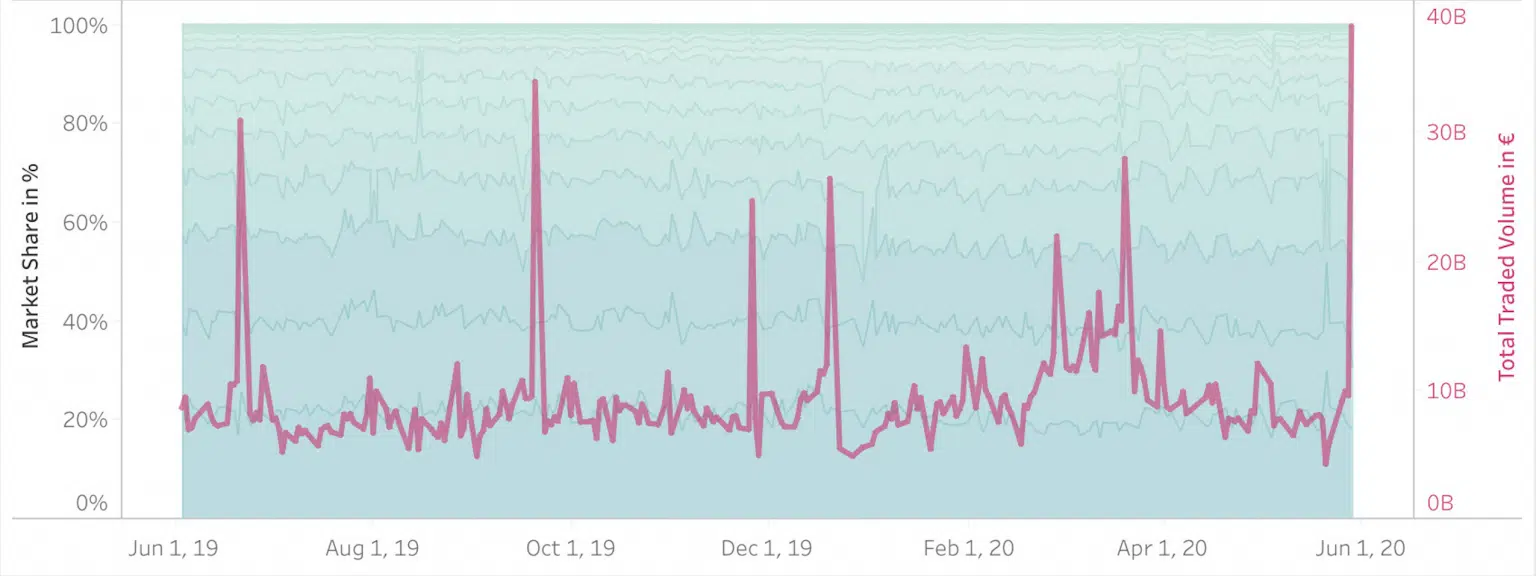
Turnover of equities including ETFs in closing auctions reached record levels on Friday. The volumes were higher than any other day during the past 12 months (including all expiry dates and rebalancing dates). 40B€ total closing notional (incl. ETFs) was reported including approximately 35B€ cumulatively in the regional indices. The increased closing activity coinciding with the MSCI rebalance also exceeded the most volatile days in Q1 precipitated by the Covid crisis. The attached screenshot was created with the Liquidity Cockpit main Traded Volumes Market Share Analysis view & selecting Closing Auctions only.
The Liquidity Cockpit has evolved thanks to continuous feedback from our clients and we are delighted to be adding to the content with a brand new Enterprise section to the menu. Our Enterprise Plan allows for unlimited dashboards. Furthermore this plan gives access to the full flexibility of the API with our technical support for its use and for integration with visualisation tools. As an example, these can be used to create custom views & dashboards for your regular or bespoke use.
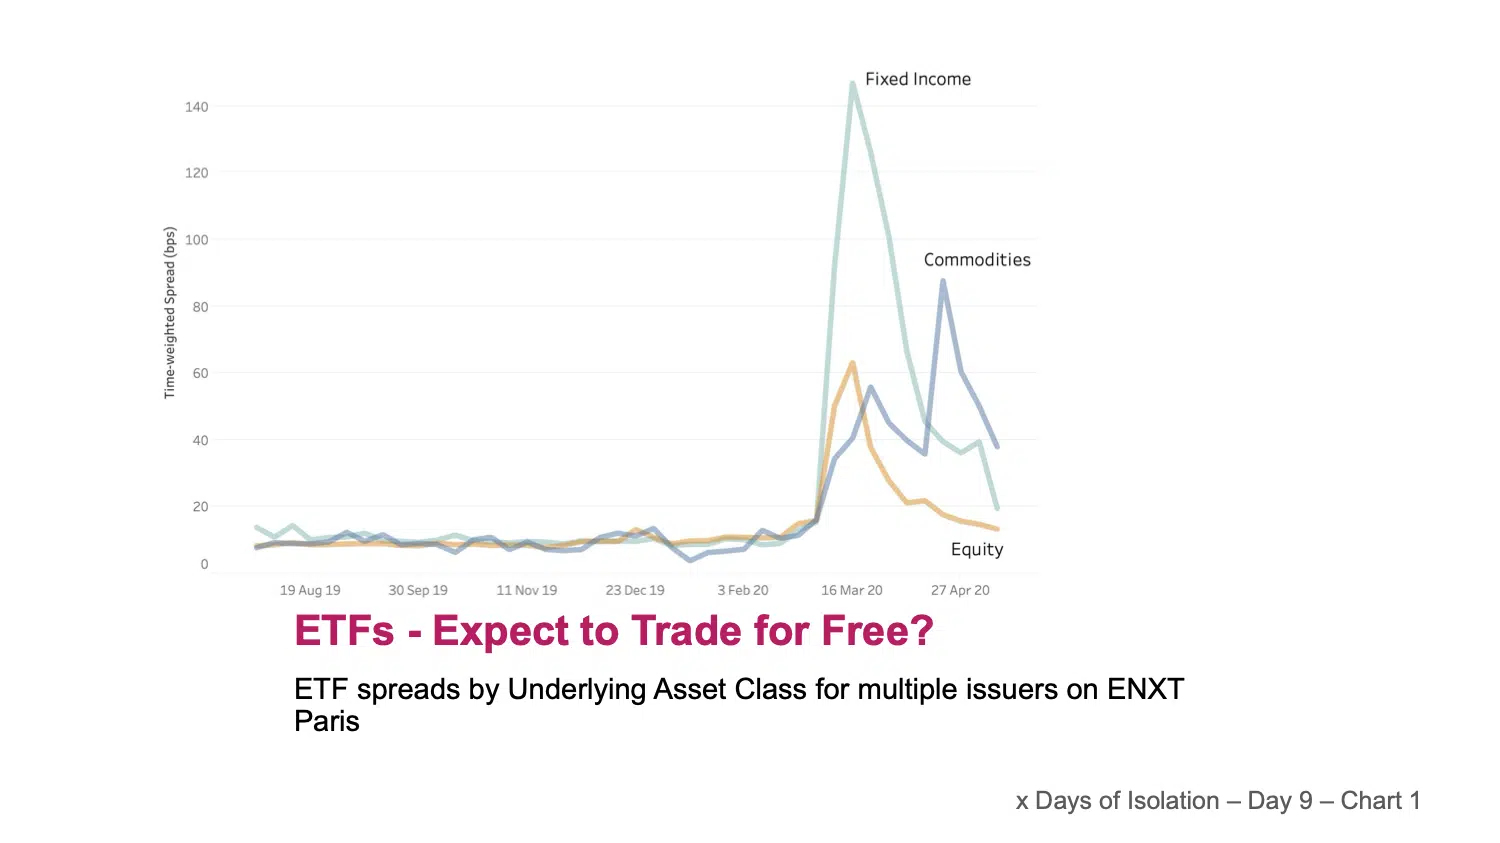
We saw how volatility during February and March resulted in an unsurprising widening of equity spreads. It sparked our curiosity to see how ETFs were affected during the same period. Market makers in ETFs base their pricing on the underlying instruments. These instruments are not limited to cash equities and may be structured to provide investors with exposure to baskets of Fixed Income instruments or Commodities as well as cash equities. The chart today shows ETF spreads grouped by underlying asset class (Equities, Fixed Income & Commodities) for around 2500 instruments quoted on Euronext Paris, one of the largest & most liquid European venues. We were struck by two notable observations. Firstly, that whilst spreads in Cash Equity, & Commodity based ETFs increased to a peak of around 4 times their normal levels, the Fixed Income based ETFs saw their spreads widened by a factor of 10 at the peak.
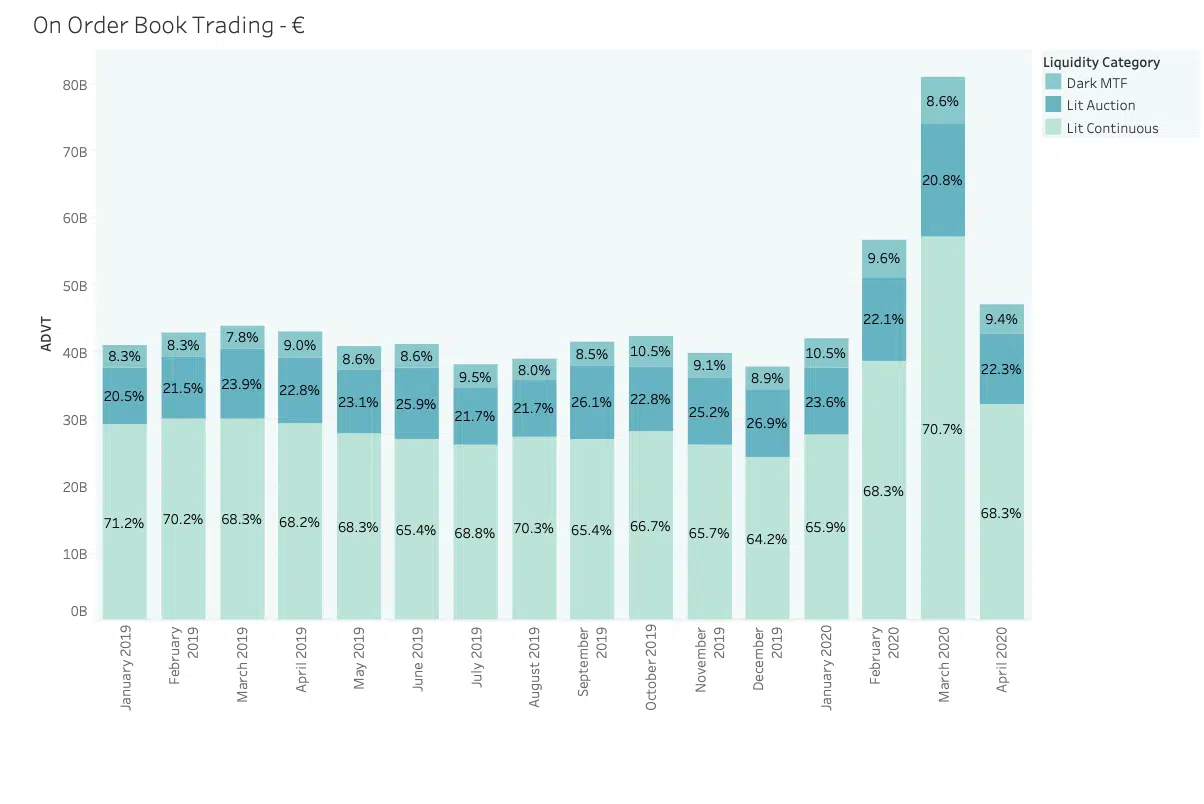
April market volumes reverted to long term average levels following the record month of March 2020. ADVT traded on the order books in European equities was 47B€, compared with 44 B€ ADVT for the full year 2019. Accompanying this apparent return to normality, the proportion of value traded in each of the three main categories of On Order book trading also resumed to their pre-crisis average. Lit Continuous volumes fell from nearly 71% of On Order Book trading back to 68%, returning market share to the Auctions and Dark Trading. Volumes are perhaps the most discussed measure of the evolution of the market, but we need to go much deeper to get a sense of whether things are returning to normal. For example, looking at trading in the most liquid names on the LSE order book, we see that liquidity available (or ‘book depth’) at up to 10bps from the touch fell over 75% from 80k€ to less than 20K€ and has still only recovered to around 30K€. The picture is similar at all order book depth in most indexes, and it’s a good reminder that volume doesn’t equal liquidity. See the chart below.
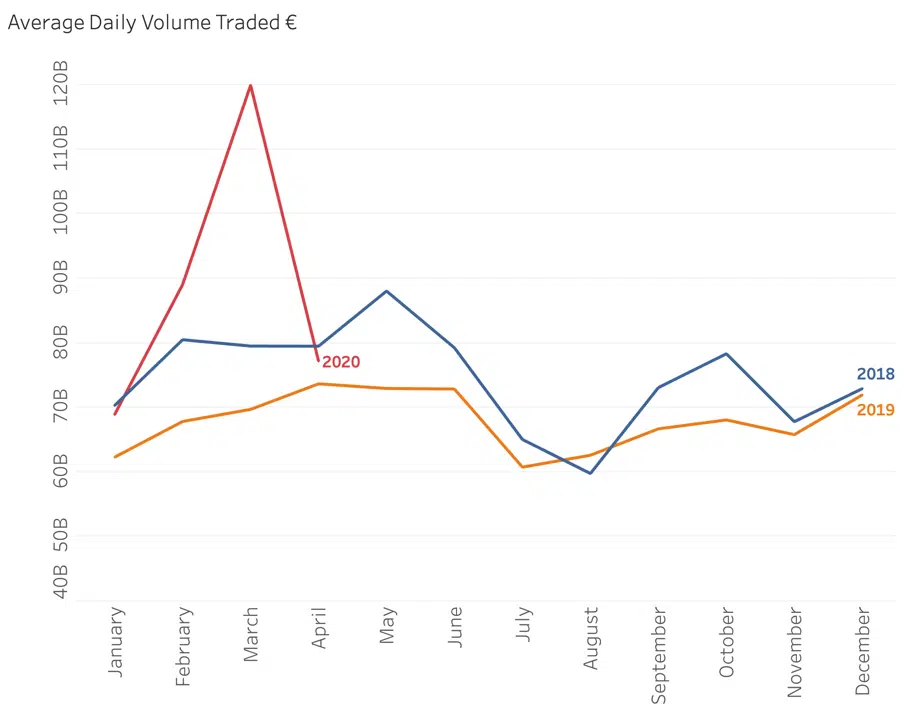
Following a bumper month for European Equity trading volumes during the Great Sell Off it seems that we may be reverting to type. Daily traded value broke through the four year record high of 148 B€ on no less than 7 days, peaking at a little under 180 B€. Then the March ADV of 120 B€ fell to just 77 B€ ADV in April, slightly above the average of 73 B€ for the full year of 2018 (67 B€ for 2019). This rally is based on much lower volumes than the crash, which are rapidly approaching the ever-decreasing long term average. Perhaps investors are not as convinced as prices imply, or maybe there is more cash to come back into the market to sustain its ascent. It would be more comforting to see a rally with some decent volumes behind it. Buyer beware.
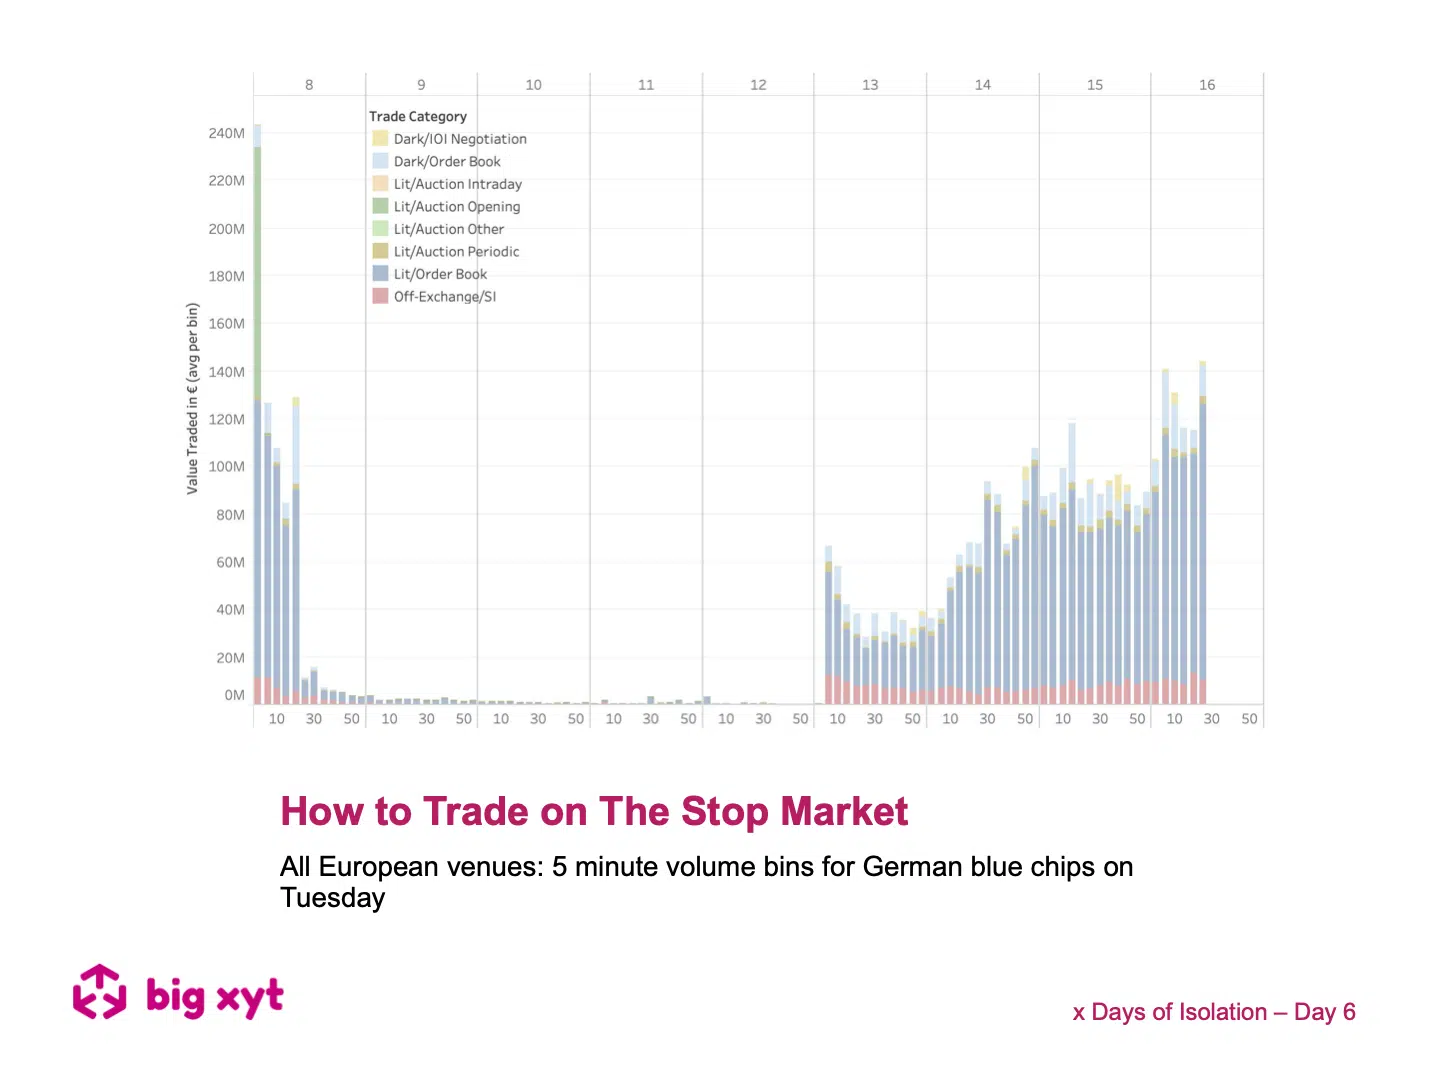
For four hours on Tuesday liquidity dried up on the primary market in Germany (plus some other XETRA powered markets) due to a technical outage. Not for the first time we observed the importance of the primary exchange in a fragmented marketplace. The chart shows volume traded on all European venues across 5 minute bins from the opening auction through to the end of continuous trading for German Large Cap Stocks. We can see all trading mechanisms reduced to virtually zero activity when the the primary market is not available. The participants normally active in Dark Pools, Periodic Auctions, competing alternative Lit venues and Systematic Internalisers all lost their appetite for business when their reference prices evaporated.
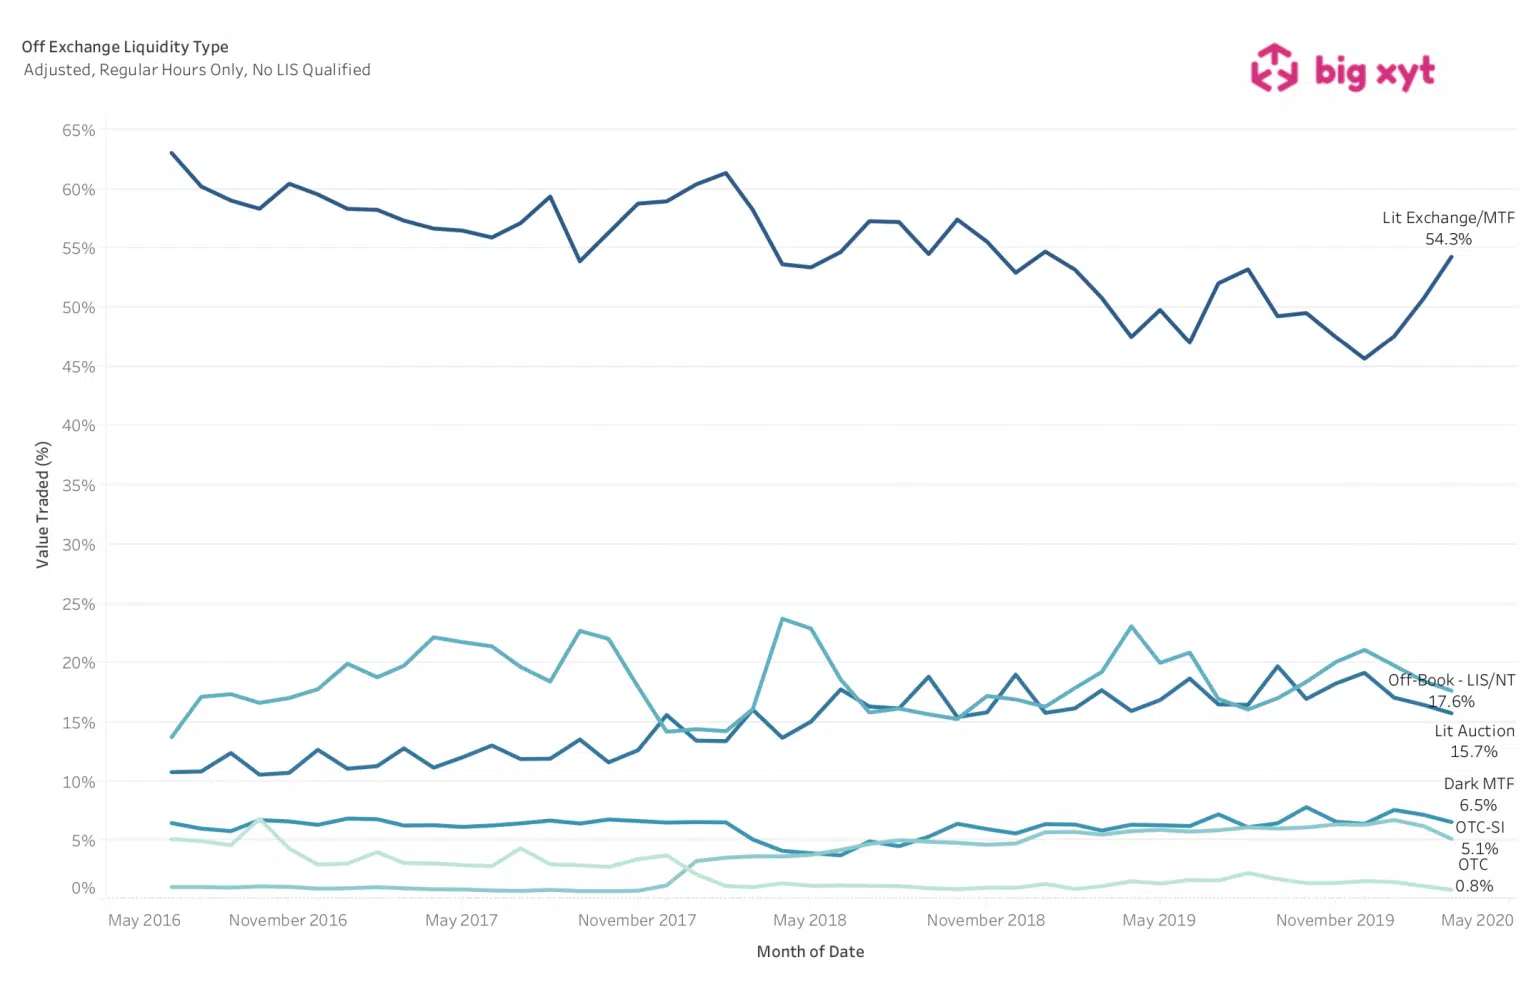
Following our first post in this series, a number of people have asked if the trend we observed has continued over subsequent days. The ingredients are consistent – uncertainty, volatile markets, and unpredictable liquidity leading to opportunity cost with other less immediate execution pathways. It is no real surprise to see lit markets continue to maintain market share at the expense of all other mechanisms. At big-xyt we can provide daily volume curves for users and algo developers in 12,000 instruments and all significant venues, as well as many other essential trading metrics. If you are interested in letting us do some of the heavy lifting for your algo infrastructure please get in touch.
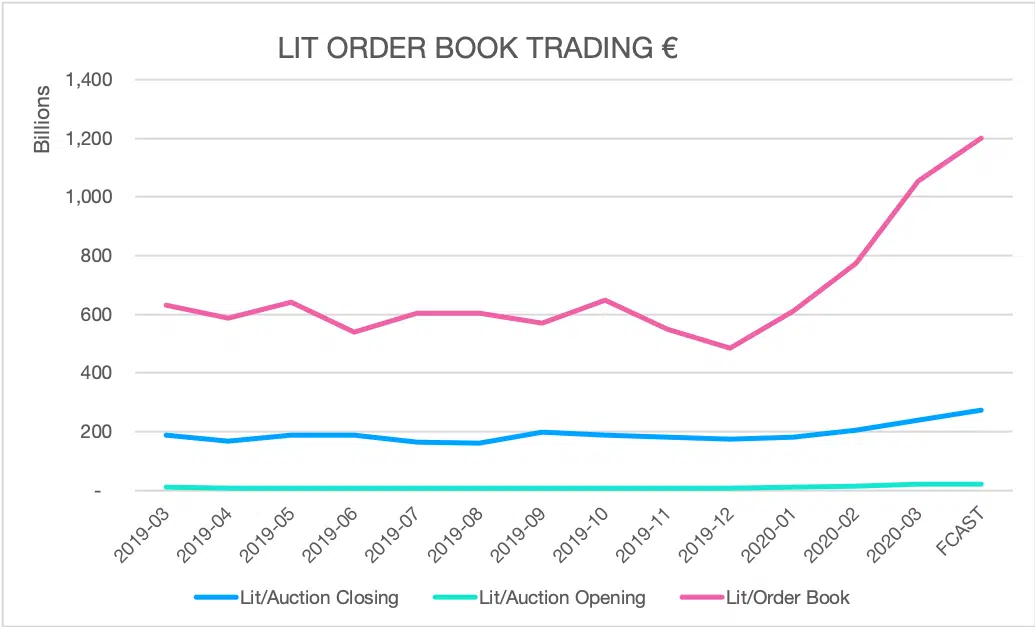
It is not news to anyone that trading volumes have simply exploded this month to record levels. We put some eye watering facts and figures on this in a historical context and look at one surprising finding; the distribution of volumes throughout the trading day has hardly changed at all. Do we detect the cool hand of trading algorithms behind this remarkable observation ? We ask some questions as to why this might be, and reflect on how far we have come with electronic trading. Article We mentioned earlier in the week that volume was returning to the lit order books from other types of trading venue – such as the end of day auctions. Just taking trades executed electronically on lit markets, we find that volumes increased from an