by Richard Hills, big xyt
Update:
April market volumes reverted to long term average levels following the record month of March 2020. ADVT traded on the order books in European equities was 47B€, compared with 44 B€ ADVT for the full year 2019. Accompanying this apparent return to normality, the proportion of value traded in each of the three main categories of On Order book trading also resumed to their pre-crisis average. Lit Continuous volumes fell from nearly 71% of On Order Book trading back to 68%, returning market share to the Auctions and Dark Trading.
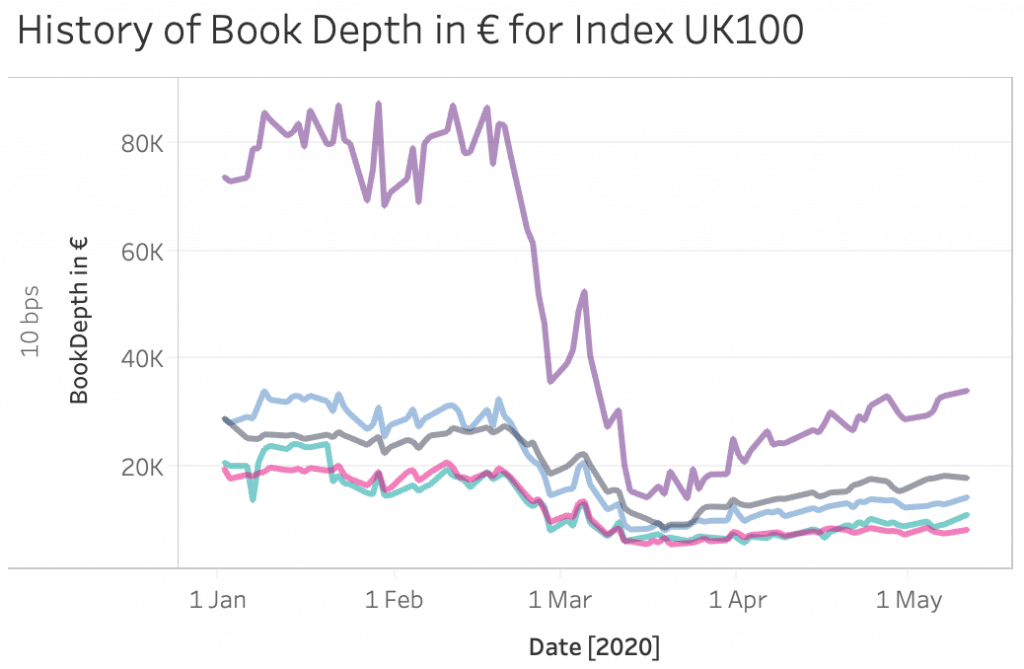
Volumes are perhaps the most discussed measure of the evolution of the market, but we need to go much deeper to get a sense of whether things are returning to normal. For example, looking at trading in the most liquid names on the LSE order book, we see that liquidity available (or ‘book depth’) at up to 10bps from the touch fell over 75% from 80k€ to less than 20K€ and has still only recovered to around 30K€. The picture is similar at all order book depth in most indexes, and it’s a good reminder that volume doesn’t equal liquidity. See the chart below.

The metric is a good measure of the market’s current (low) appetite for risk and of ongoing uncertainty. It reflects subdued activity on the part of natural buyers and sellers around which the fair price forms, and the greater premium being applied for liquidity provision by market makers as volatility remains high. But it still doesn’t tell the full picture, because spreads have also moved out dramatically; LSE At Touch spreads on the same index increased from a normal level of around 5bps to 11bps in March and only returned to 8.5bps in April. So that reduced level of liquidity is still over 50% more expensive than it was before.
We also note that the picture is nuanced, with variations between the country indexes and individual securities. For example, the size of the touch on several primary exchanges reduced in comparison to the MTFs in many cases, again only partially recovering in April. Have a look in the Liquidity Cockpit at our EBBO Presence measure to see for yourself. The microstructure has a lot to tell us about how the market is feeling. These measures when combined with many others can be important input to investment strategies as well as execution strategies, for example in telling us about the level of conviction behind market momentum. At big-xyt we capture hundreds of microstructure metrics in fine levels of granularity and in thousands of stocks and ETFs and over several years. For Liquidity Cockpit users these can be accessed through our GUI or the powerful API visiting our Liquidity Cockpit.
Do you want to receive future updates directly via email? Use the following form to subscribe.
On our x Days of Isolation
During these unprecedented times we do not underestimate the professional and personal challenges that everyone is facing. There are far more important things to be doing in the community than looking at a screen.
However, data and data analytics is playing a critical part in providing solutions to the current global crisis. Furthermore, the markets remain open and whilst they do, the trading community needs to be well informed in order to understand the changing market landscape. As a result, big xyt is receiving an increasing number of requests for observations of changing trends and behaviours in the equity markets. We are excited to have recently expanded our London team to enrich our content and support for clients seeking greater market insights from an independent source. Whilst many adjust to the new experience of working from home we plan to share some of these thoughts, observations and questions in the coming days & weeks.
As ever we welcome feedback as this can shape further contributions from our team and the Liquidity Cockpit our unique window into European equity market structure and market quality.
We hope you enjoy them.
—
This content has been created using the Liquidity Cockpit API.
About the Liquidity Cockpit
At big-xyt we take great pride in providing solutions to the complex challenges of data analysis. Navigating in fragmented markets remains a challenge for all participants. We recognise that the investing community needs and expects continued innovation as the volume of data and related complexity continues to increase.
Our Liquidity Cockpit is now recognised as an essential independent tool for exchanges, Sell-side and increasingly Buy-side market participants. Data quality is a key component, as is a robust process for normalisation so that like-for-like comparisons and trends over time have relevance. However, our clients most value a choice of flexible delivery methods which can be via interactive dashboard or direct access to underlying data and analysis through CSV, API or other appropriate mechanism.
For existing clients – Log in to the Liquidity Cockpit.
For everyone else – Please use this link to register your interest in the Liquidity Cockpit.


