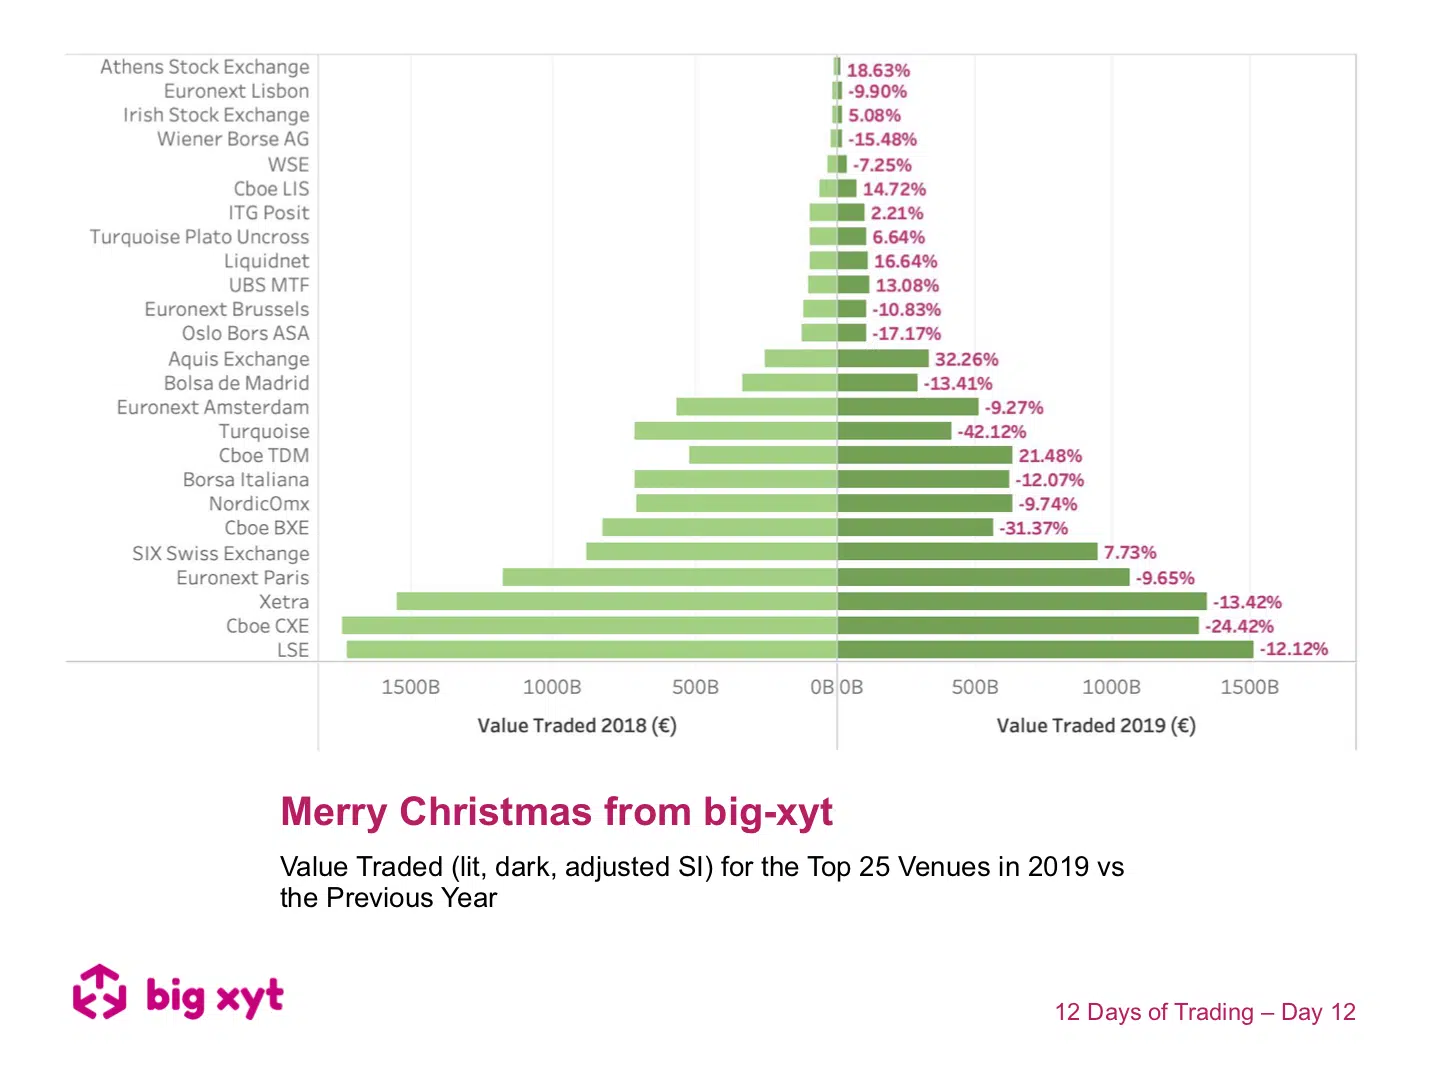
Well, it’s Christmas Eve folks and what better way to see out the old & see in the new year than to reflect on the changes in the last 12 months. We look forward to introducing new content to help provide 2020 vision next year, so watch this space. In the meantime, the chart today, whilst festive in its intent does show some changing trends throughout the year. As a backdrop to these changes, overall volumes declined 12% during the period and the Swiss non-equivalence influenced that particular market from July. If you have found these pieces of analysis useful, you will find there is a lot more you can do with our Liquidity Cockpit. Clients using our Execution Analysis/TCA are able to measure execution performance with the demonstrated precision and flexibility
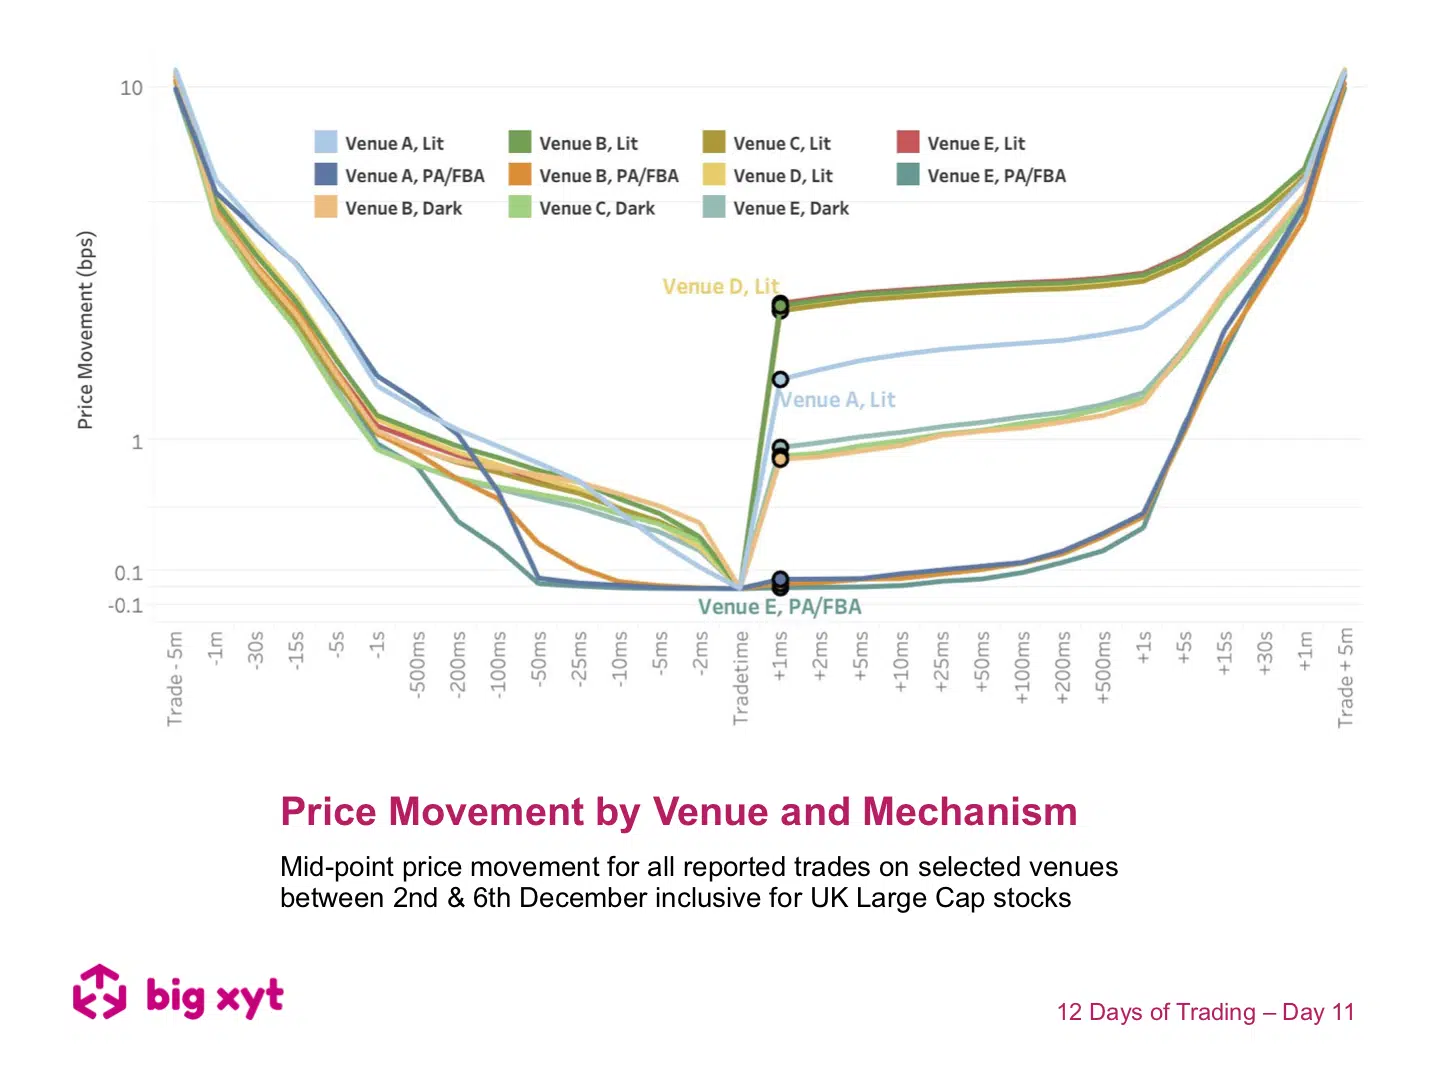
The chart today returns to a theme we have covered before but with additional layers uncovered. In the past, we have viewed the movement of the mid point before and after every trade to build up a pattern for each trading mechanism. We have developed this further so that each venue can be singled out whether lit, dark or periodic auction. We have anonymised the venues and excluded blocks and a generic view of Systematic Internalisers from this example. Subscribers to our Liquidity Cockpit API can see this detail in all its glory. Using these new metrics and categorisations is creating new thinking in execution analysis. In addition to comparisons with recognised benchmarks, traders can now see how they compare to a typical profile when they or their brokers route to different venues and market mechanisms.
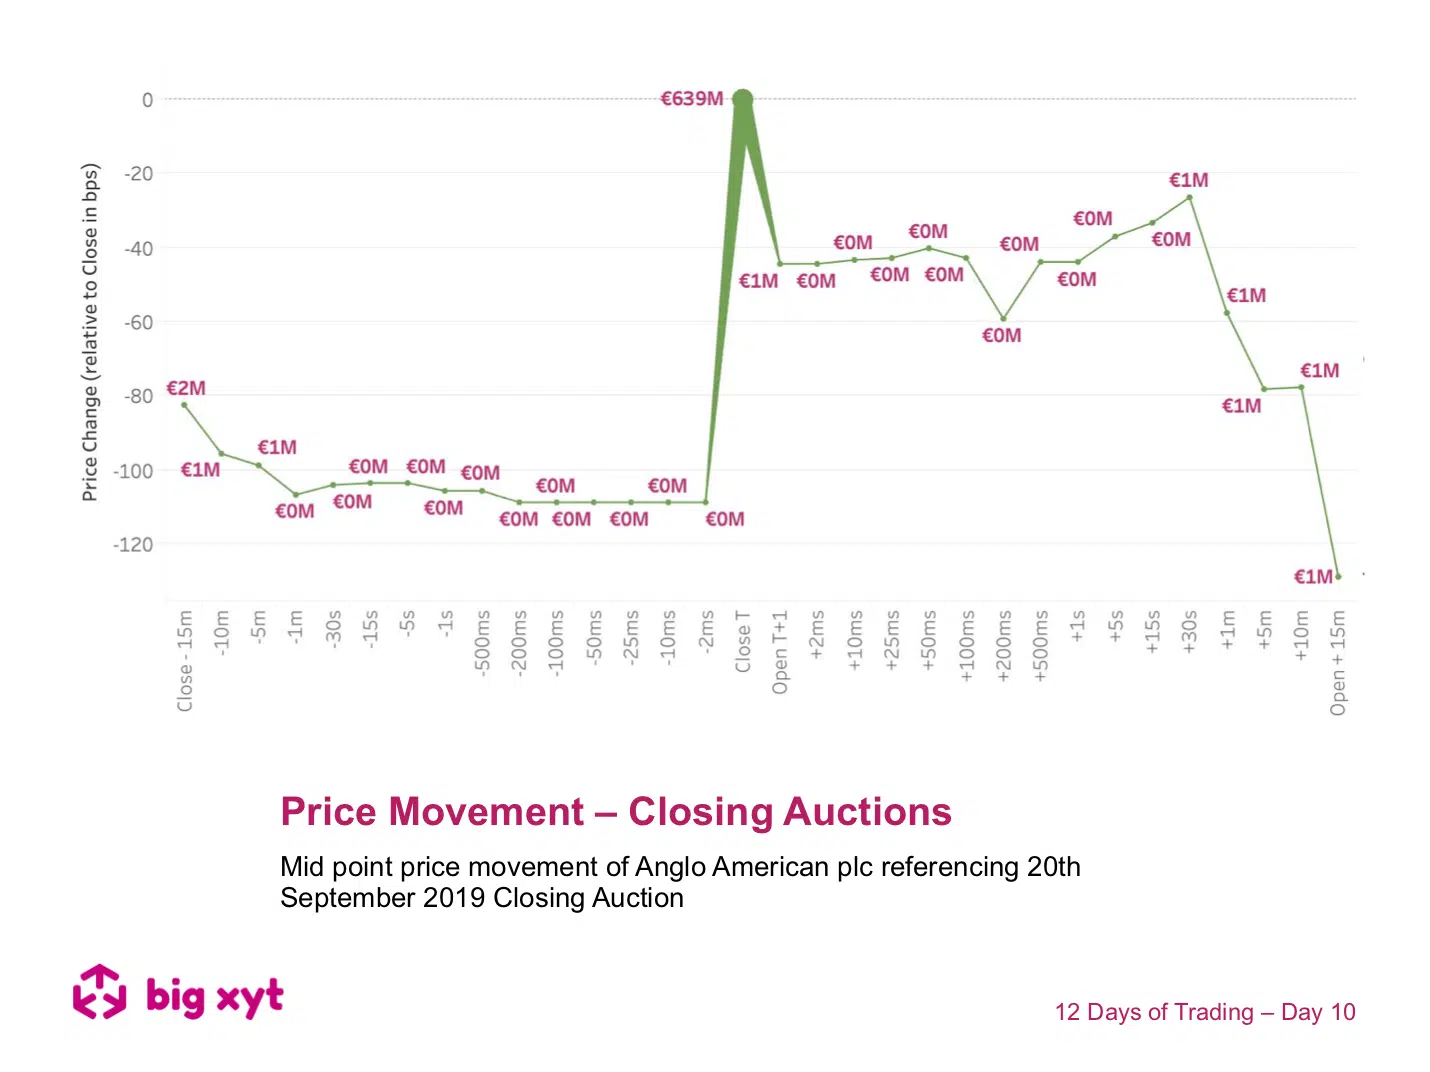
Following previous observations of the growing significance of the closing auction we felt curious as to whether a benchmark price should be the best driver of liquidity. As we saw yesterday, investors were quick to embrace the opening auction and trade more throughout the day when trader/fund manager conviction is higher such as last Friday 13th. So what happens on days when closing volumes are greater, such as index rebalance and derivative expiry days? As you may have seen, we have examined intraday price movement in the past to compare market mechanisms. Today we are introducing a view of movement around the closing price.
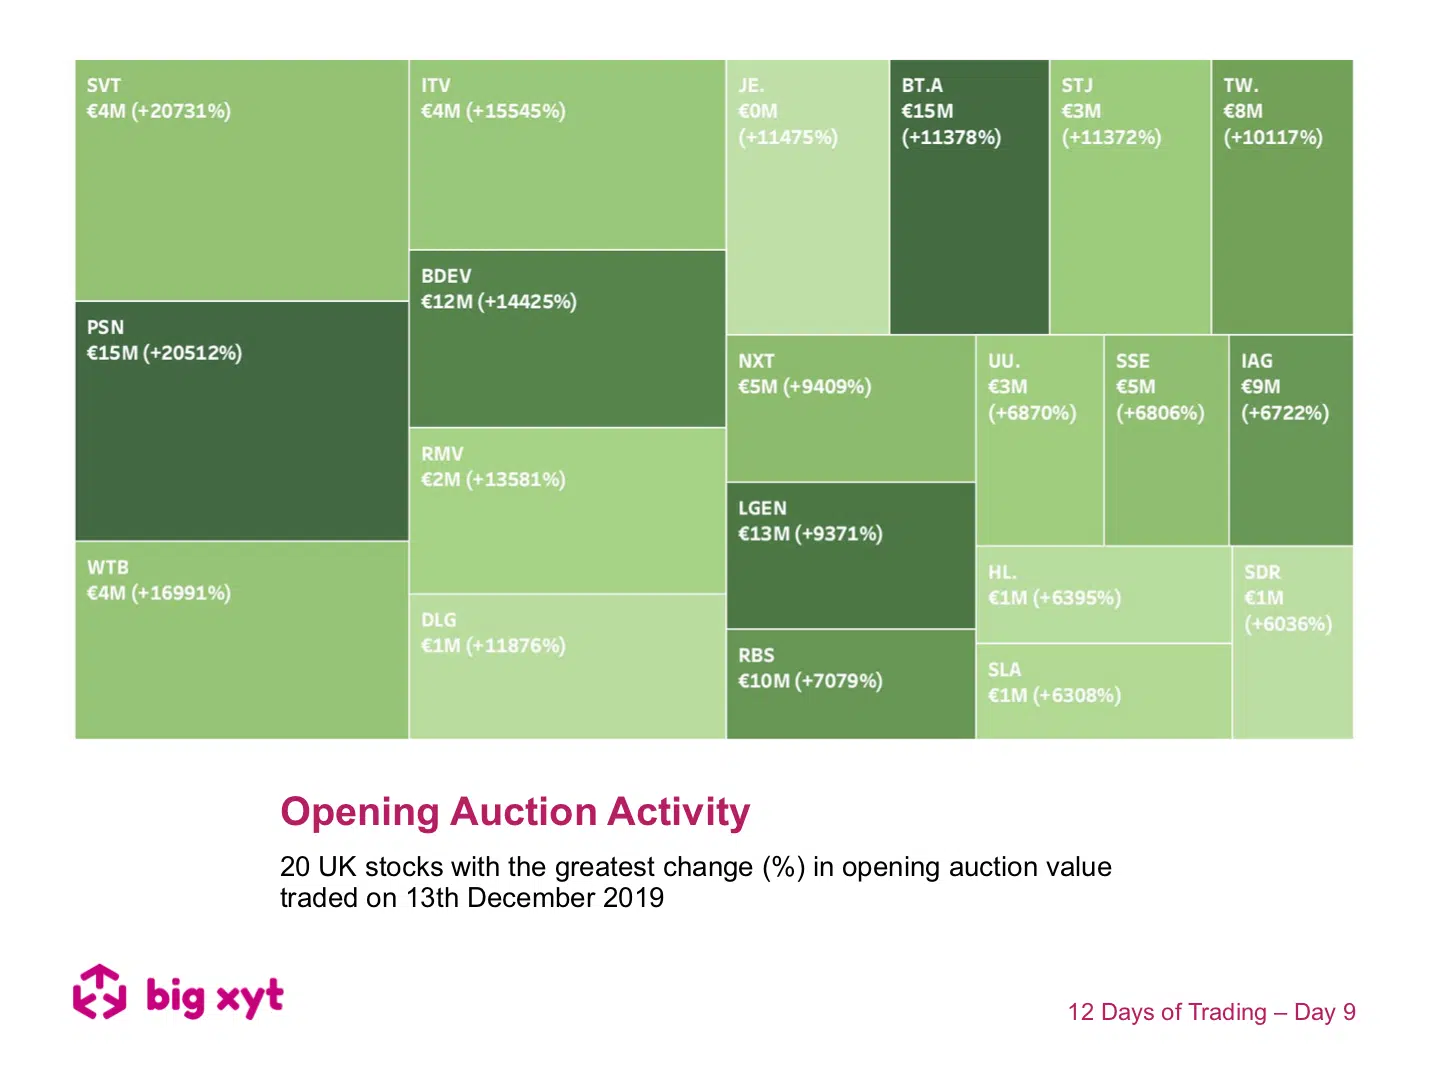
On the morning after the General Election, the chart shows the 20 stocks with the greatest percentage change in opening auction turnover. This could be taken as a proxy for company sensitivity to the political implications as investors acted with both speed and size. This sample is limited for ease of view and the full universe can be viewed and normalised by block size, for example, or absolute value traded. Let us know if you would like to see similar results for block trades during the rest of the same day as investors scrambled to adjust their exposure. Liquidity Cockpit users are able to look at any stock this way and see the venues broken down. Clients using our
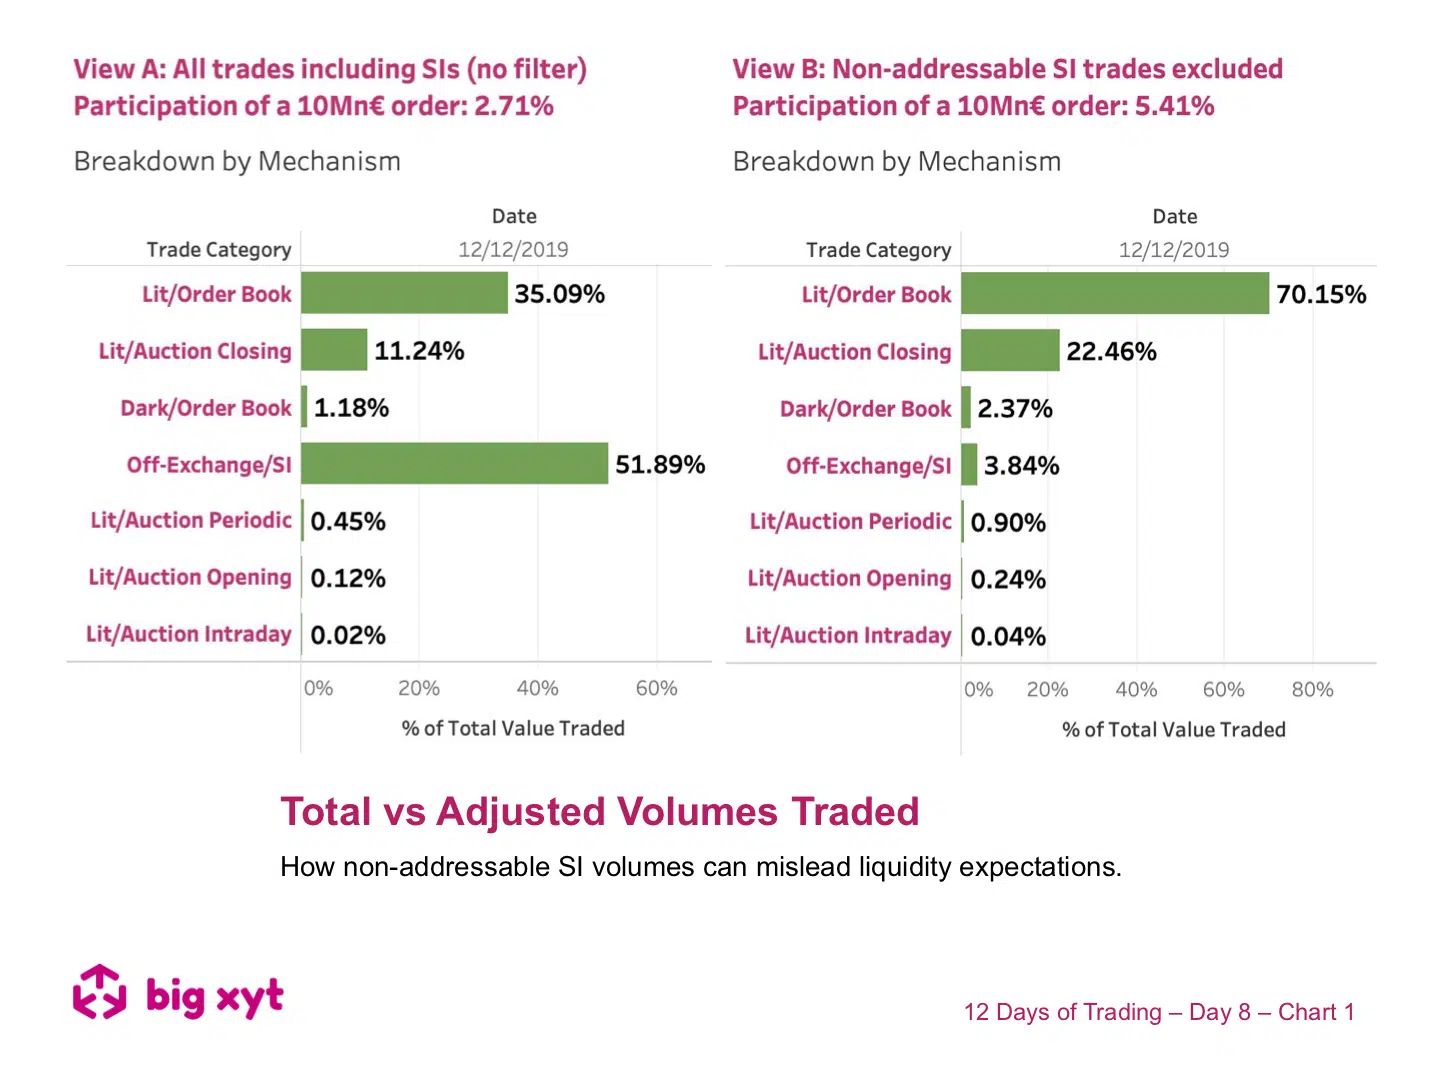
Understanding where the expected liquidity is available is key to any participation strategy. However, if your assumptions relating to expected liquidity include all reported trades, you could find yourself starting from the wrong place. This example looks at Munich Re shares traded on the 12th December (a relatively “normal” day before the UK General Election results were announced). A typical institutional sized order of €10Mn would need to be careful not to impact the market. In view A, on the left, the order represents 2.71% of the days total reported turnover in the stock. But how much of the Systematic Internaliser (SI) volume is unaddressable and gives an over optimistic picture of available liquidity?
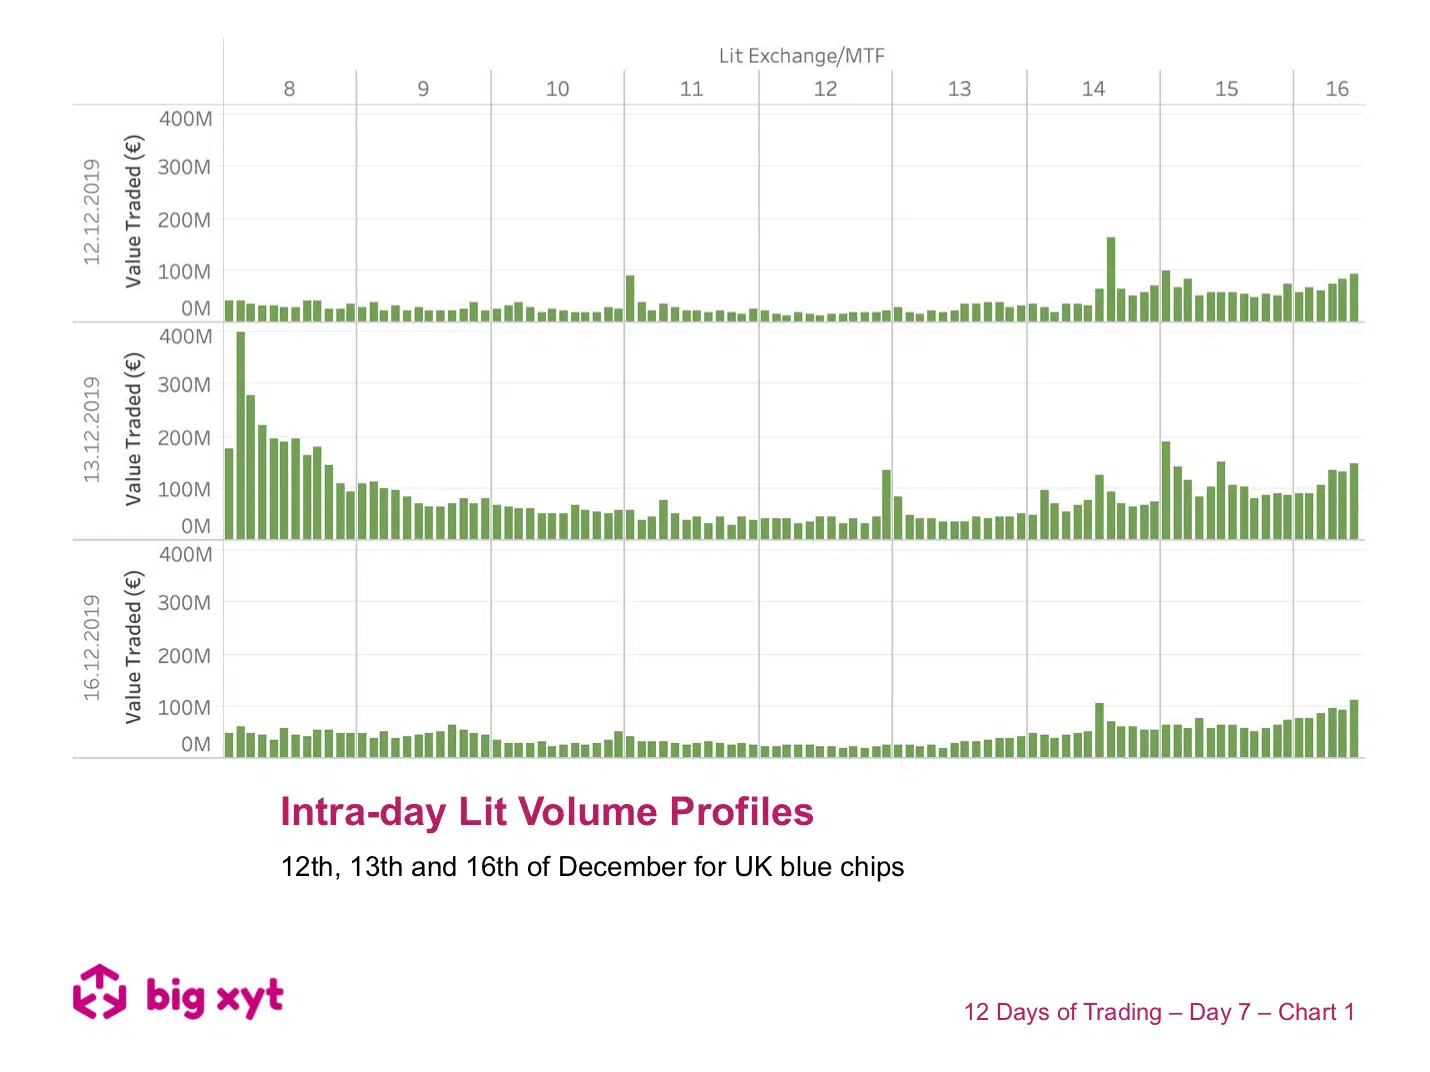
There was too much happening on Friday not to revisit how the General Election result shifted traders’ focus from liquidity based benchmarks to urgency of execution. Having seen the increased opening auction activity on Friday 13th, we wondered if it was unlucky for some router configurations as they did their best to navigate a non-standard day of liquidity profiles? Today we have two comparative sets of charts to introduce and examine the intraday volume profile (in this case for UK blue chips). If this was your crystal ball you would have used it on Friday, for example, to target the volume weighted average price (VWAP). In chart one we see how lit volumes, split into five minute buckets, vary through the continuous trading session (i.e. not including the open & closing auctions). The top chart is polling day (12th) the middle chart
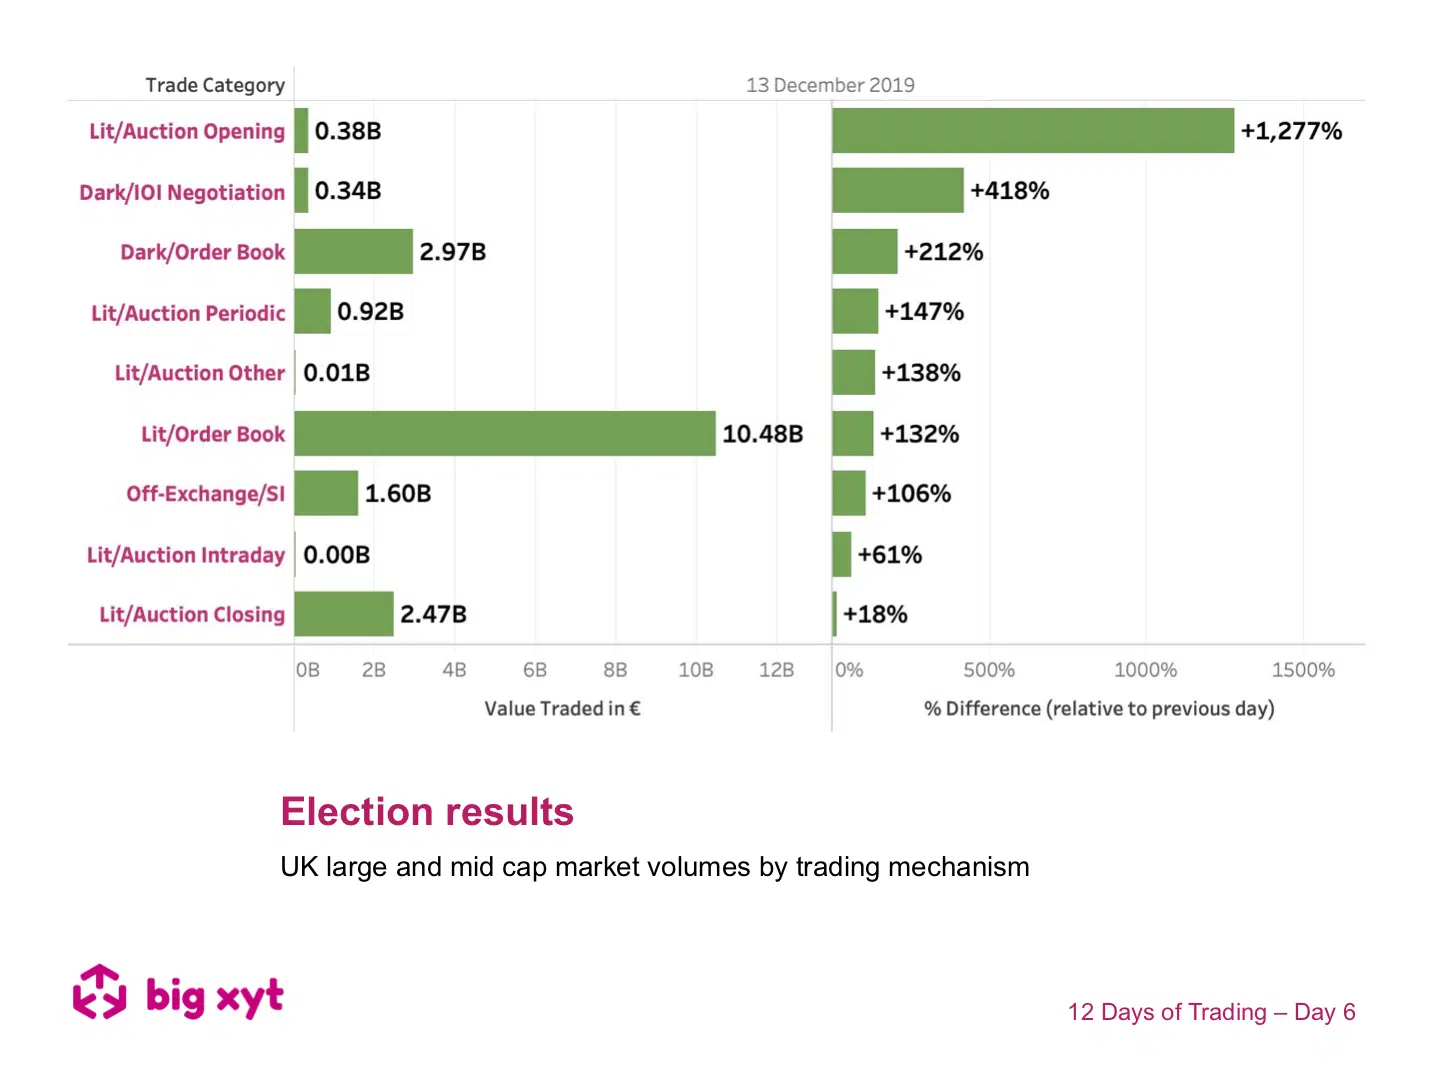
The impact of the results of the UK General Election on market volumes was dramatic, with UK volumes more than doubling. We looked more closely at how the underlying venues and mechanisms benefitted in relative terms. The left hand side of the chart shows the volumes traded on Friday by mechanism. The right hand side shows the percentage increase by mechanism compared to the previous day. Market participants needed to react quickly to position themselves. This can be clearly seen with the opening auction having the greatest change relative to the previous day. Second were the Large In Scale and dark venues. Under these conditions, different strategies are necessary for speed of implementation and access to significant blocks of liquidity. The mechanism least affected was the closing auction. This raises interesting questions about what has driven the growing popularity of the Closing Auctions at the expense of the rest of the trading day.
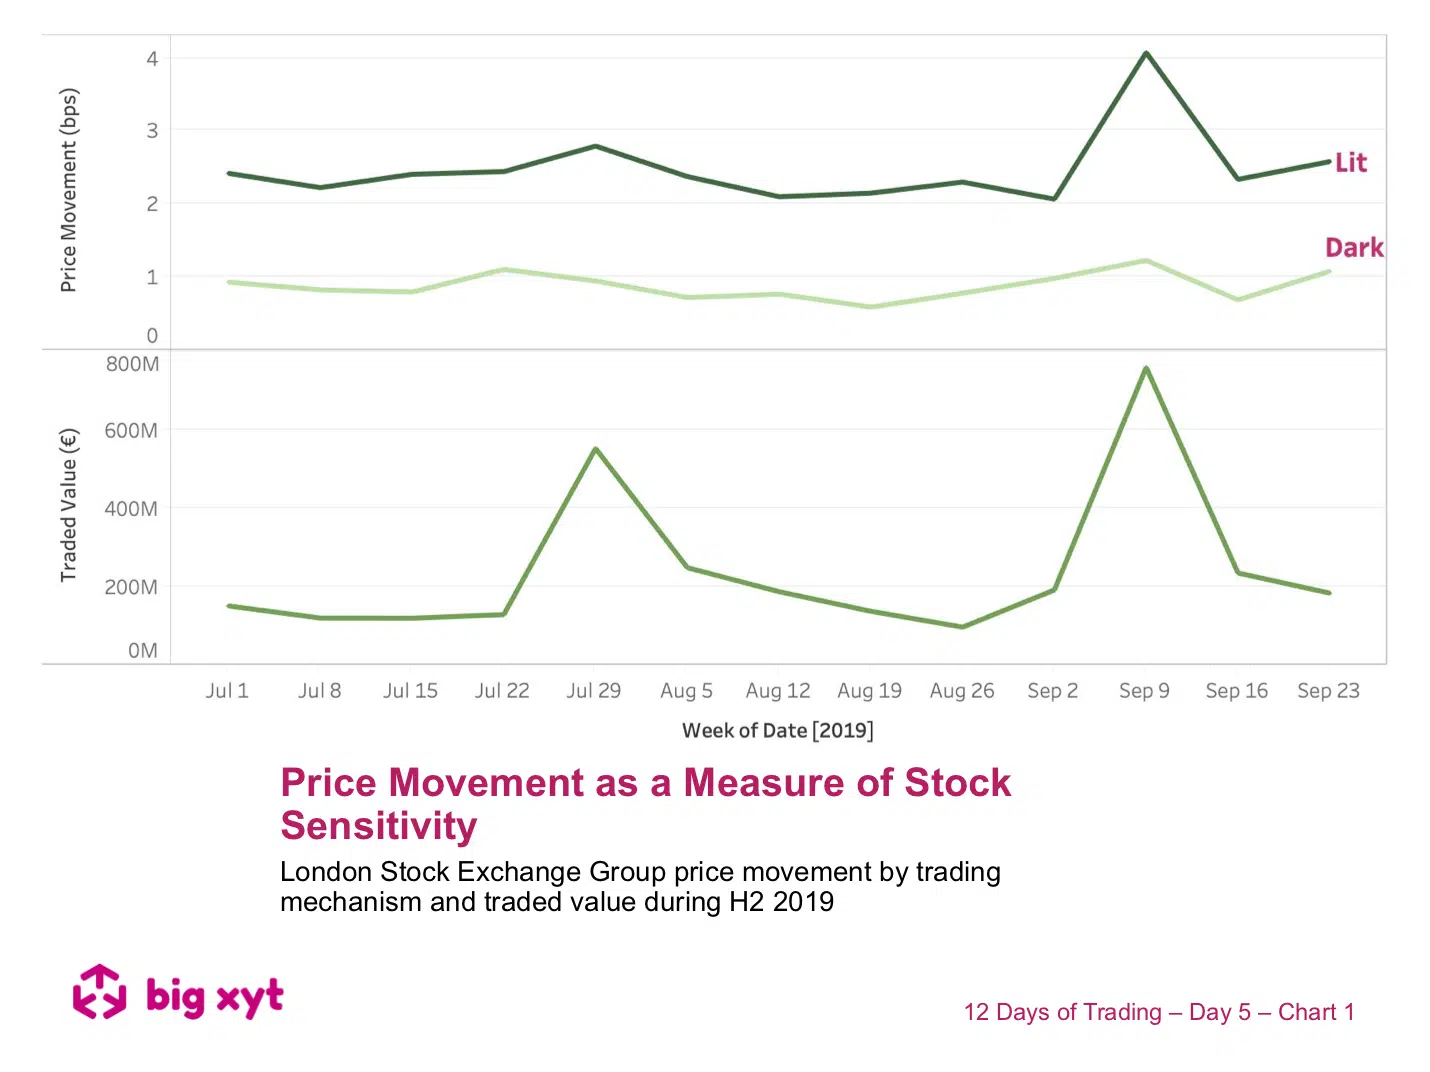
Price movement after a trade or reversion can be used as a measure of toxicity, aggression, or stock price sensitivity. Today we are returning to our example of LSEG both as a bidder and a target. The metrics we are using relate to price movement in two key trading mechanisms; lit & dark.The bottom chart shows traded value in the stock and helps us to pinpoint the days when the respective news stories broke. The top chart shows the price movement (absolute change of the mid price within 1ms) for every trade aggregated up as a daily average. This would seem to indicate greater stock sensitivity at times of increased turnover. However, look closer and when comparing lit and dark we see that the summertime Refinitiv announcement resulted in increased dark sensitivity in advance of the lit peak, whereas for the September HKSE approach the peaks are simultaneous.
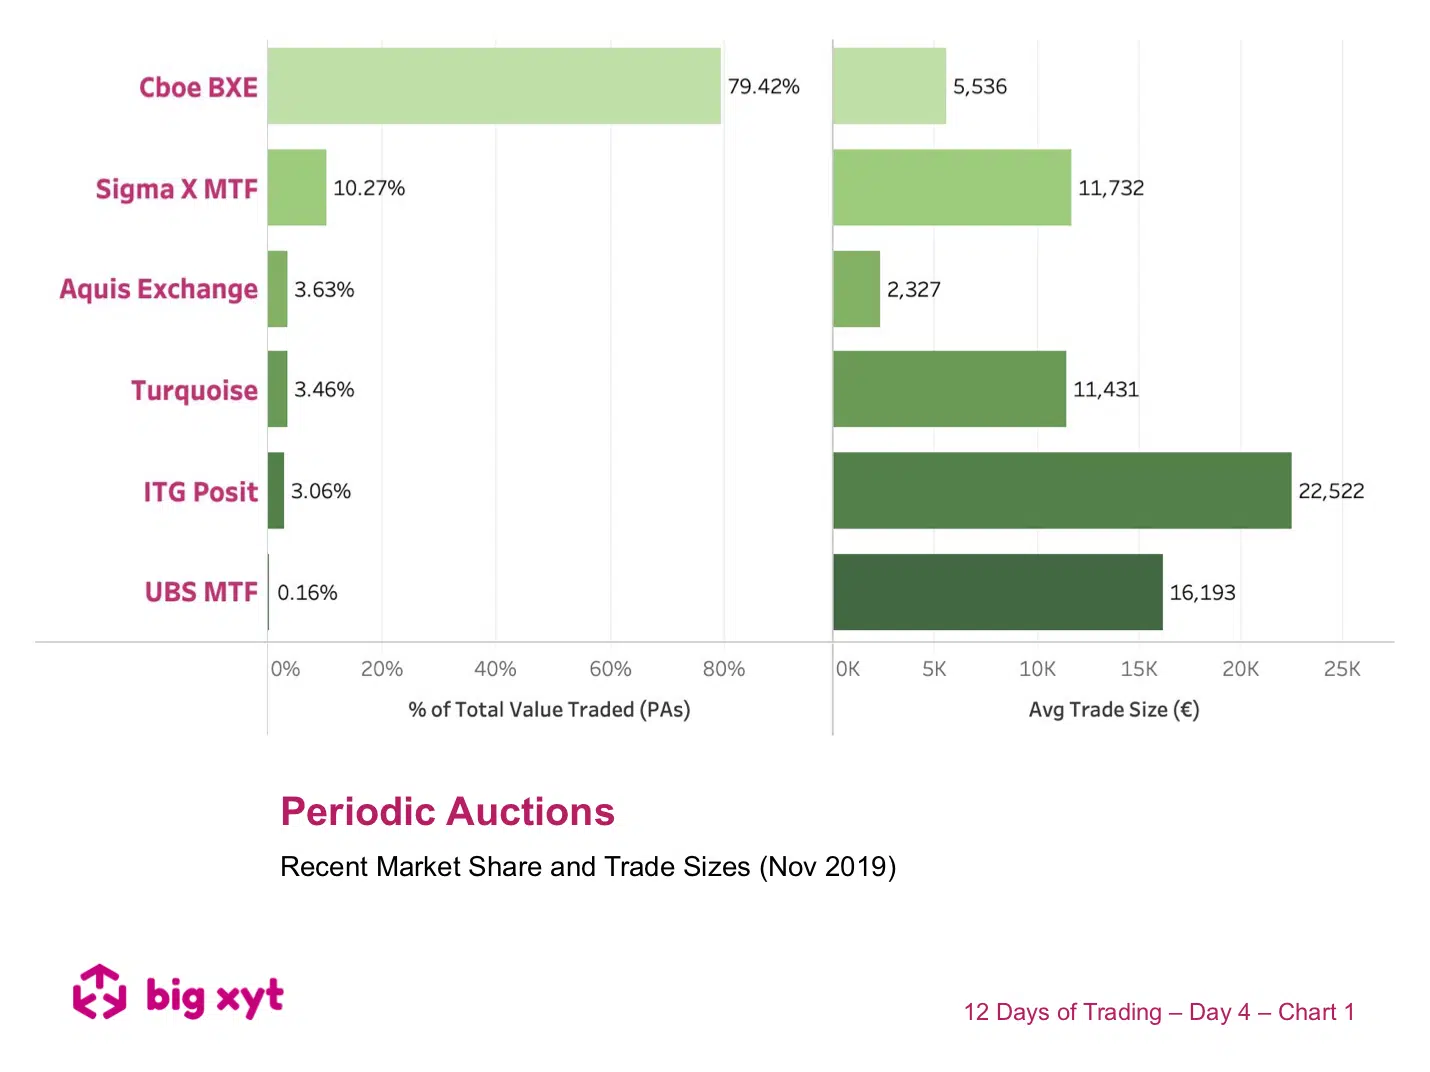
Just as market share and trade size give us measures of market quality for lit markets, similar metrics can be applied to periodic auctions. The overall share of periodic auctions as a mechanism has been remarkably stable over the last year but the share and average size amongst the various operators have been changing. Today we take a snapshot of the most recent monthly picture. Note that in this example we have excluded on-demand auctions, offered by some primary venues. Our Liquidity Cockpit allows the identity of these venues to be revealed to enable you to ask if you are sourcing the best liquidity, at the best price, by market, by venue, by index or at stock level. — Do you want to receive future updates directly via email? Use the following
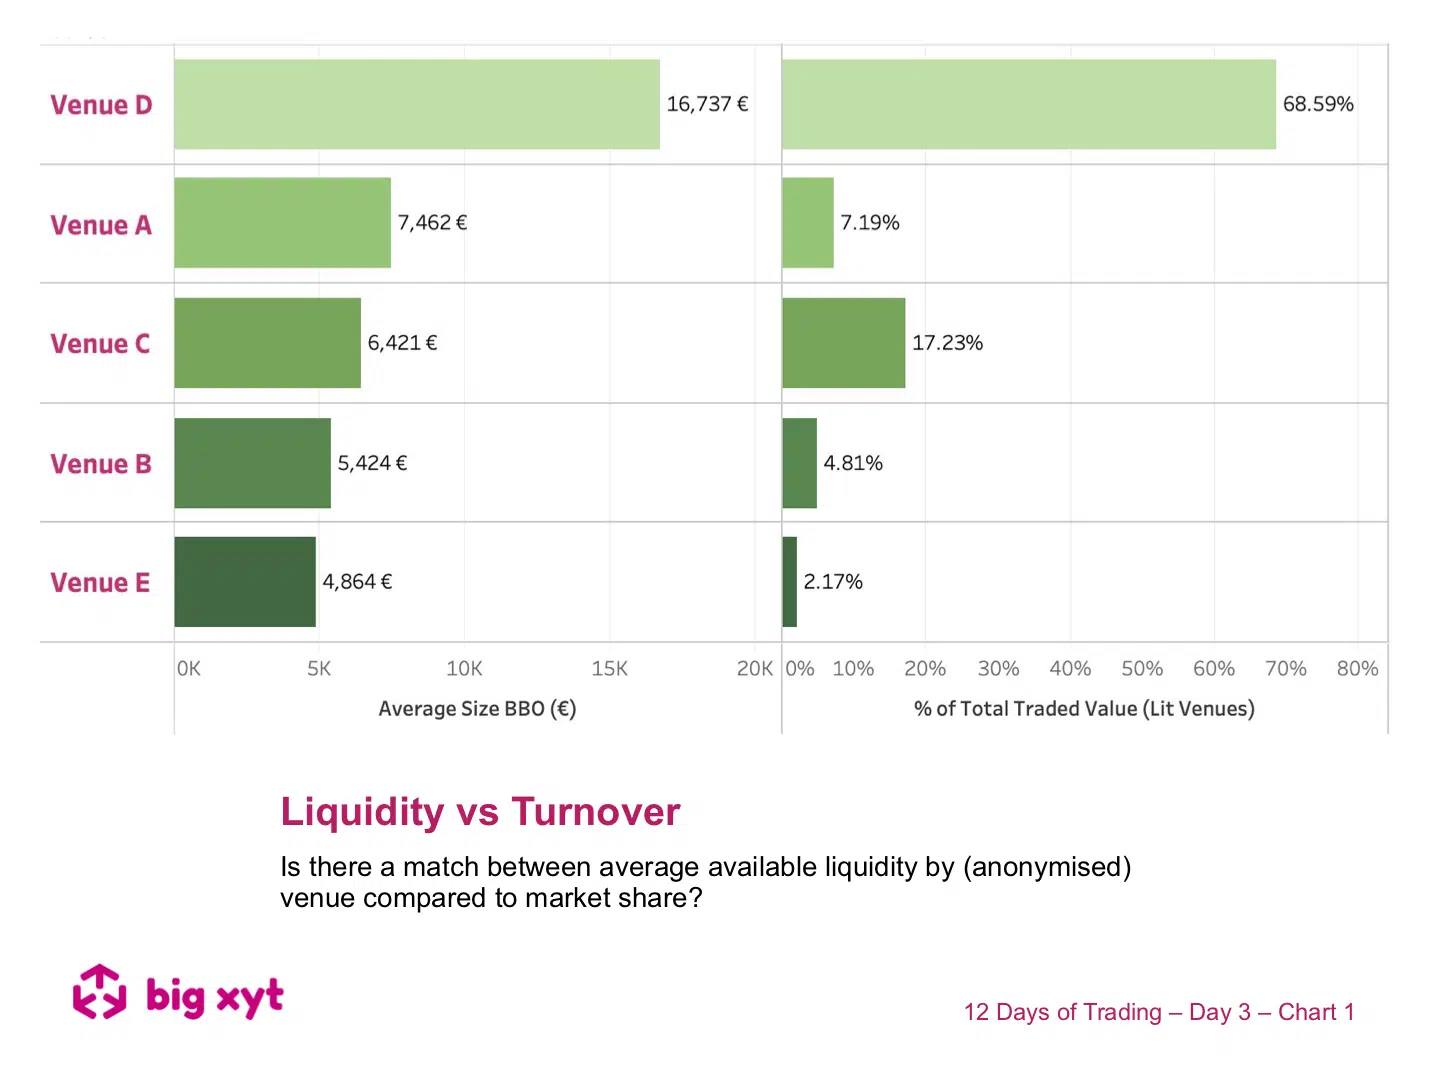
We have demonstrated in previous posts that there is a correlation between spreads and market share. The venue with the highest turnover tends to have the best prices. However, as the regulators keep reminding us, best execution should factor in liquidity as well as price. In the chart today we take a look at one European market and find that the rankings for turnover do not always match the rankings for available liquidity at the touch across the anonymised venues. Our Liquidity Cockpit allows the identity of these venues to be revealed to enable you to ask if you are sourcing the best liquidity, at the best price, by market, by venue, by index or at stock level. — Do you want to receive future updates directly via email? Use the following