The Liquidity Cockpit has evolved thanks to continuous feedback from our clients and we are delighted to be adding to the content with a brand new Enterprise section to the menu. Our Enterprise Plan allows for unlimited dashboards. Furthermore this plan gives access to the full flexibility of the API with our technical support for its use and for integration with visualisation tools. As an example, these can be used to create custom views & dashboards for your regular or bespoke use.
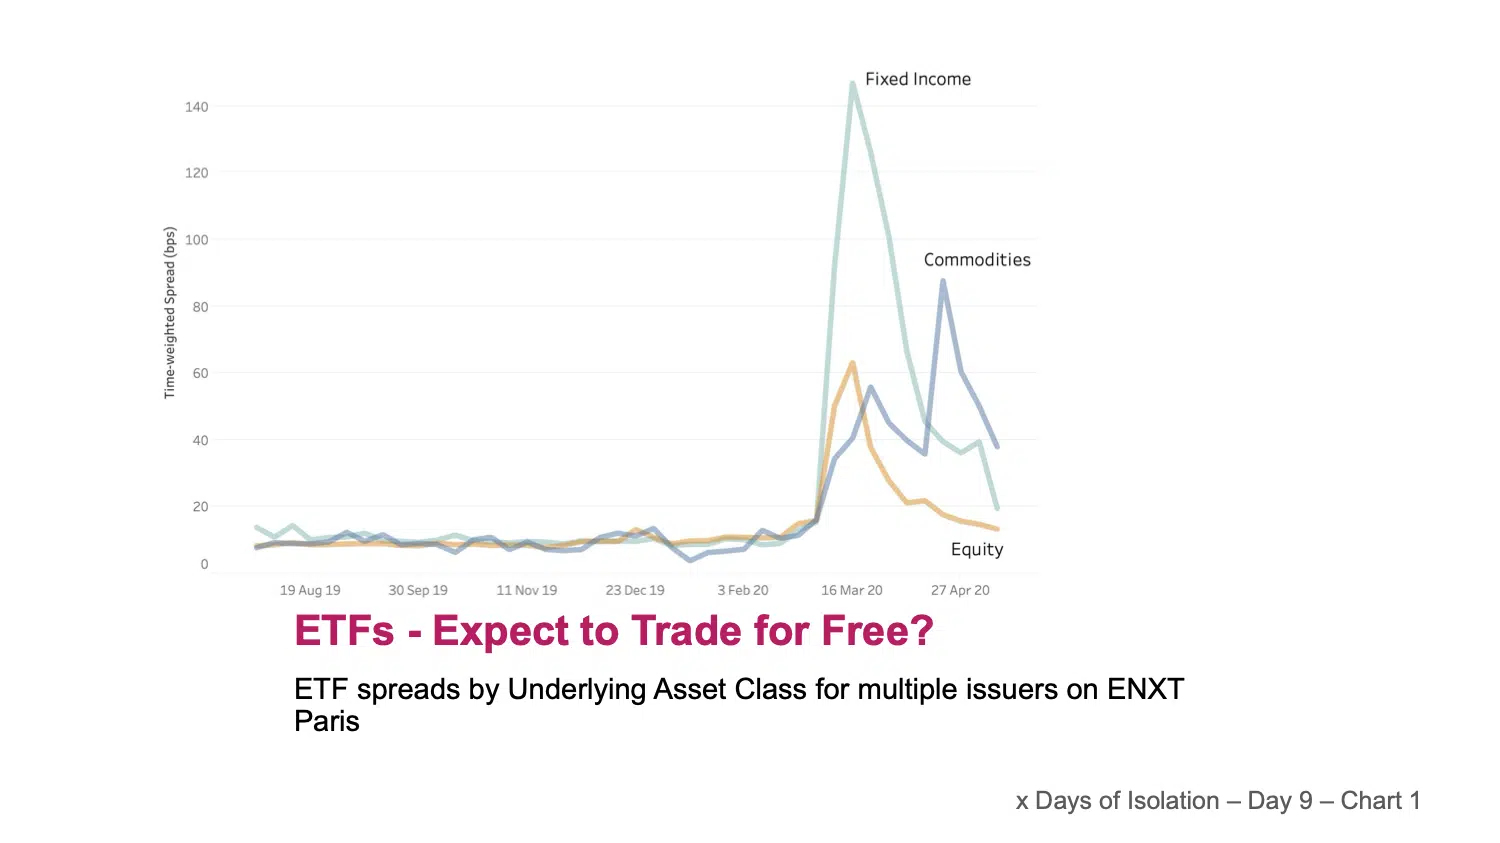
We saw how volatility during February and March resulted in an unsurprising widening of equity spreads. It sparked our curiosity to see how ETFs were affected during the same period. Market makers in ETFs base their pricing on the underlying instruments. These instruments are not limited to cash equities and may be structured to provide investors with exposure to baskets of Fixed Income instruments or Commodities as well as cash equities. The chart today shows ETF spreads grouped by underlying asset class (Equities, Fixed Income & Commodities) for around 2500 instruments quoted on Euronext Paris, one of the largest & most liquid European venues. We were struck by two notable observations. Firstly, that whilst spreads in Cash Equity, & Commodity based ETFs increased to a peak of around 4 times their normal levels, the Fixed Income based ETFs saw their spreads widened by a factor of 10 at the peak.
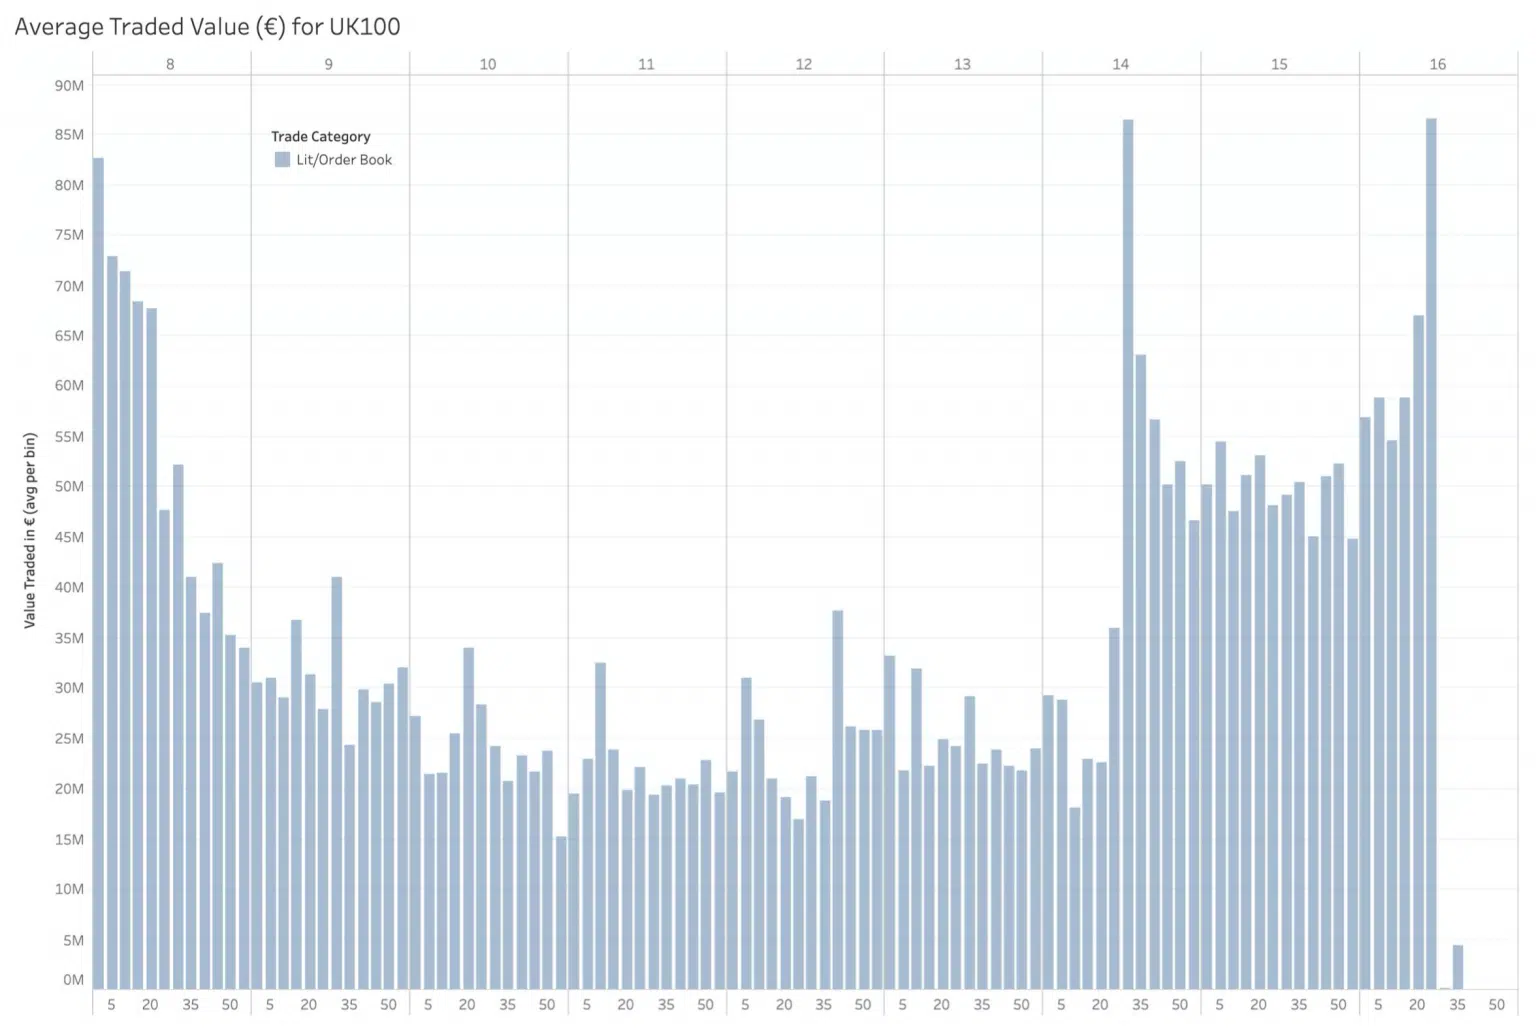
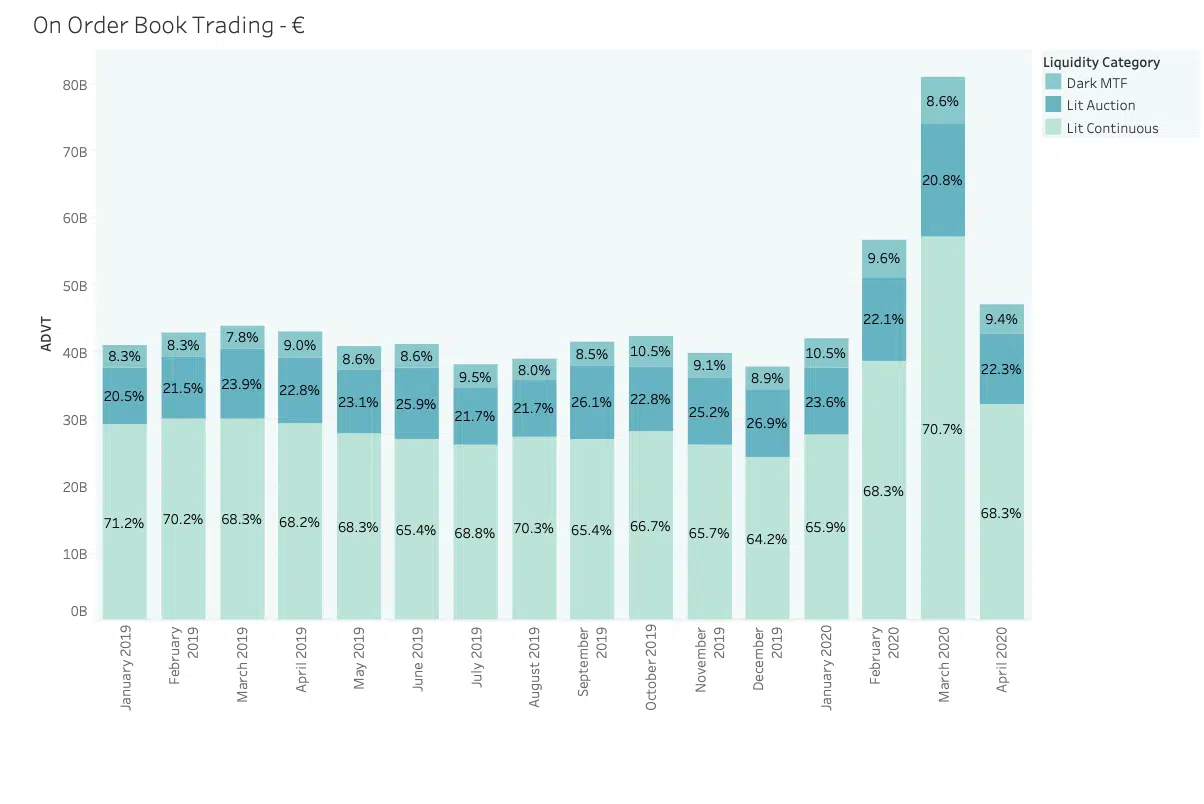
April market volumes reverted to long term average levels following the record month of March 2020. ADVT traded on the order books in European equities was 47B€, compared with 44 B€ ADVT for the full year 2019. Accompanying this apparent return to normality, the proportion of value traded in each of the three main categories of On Order book trading also resumed to their pre-crisis average. Lit Continuous volumes fell from nearly 71% of On Order Book trading back to 68%, returning market share to the Auctions and Dark Trading. Volumes are perhaps the most discussed measure of the evolution of the market, but we need to go much deeper to get a sense of whether things are returning to normal. For example, looking at trading in the most liquid names on the LSE order book, we see that liquidity available (or ‘book depth’) at up to 10bps from the touch fell over 75% from 80k€ to less than 20K€ and has still only recovered to around 30K€. The picture is similar at all order book depth in most indexes, and it’s a good reminder that volume doesn’t equal liquidity. See the chart below.