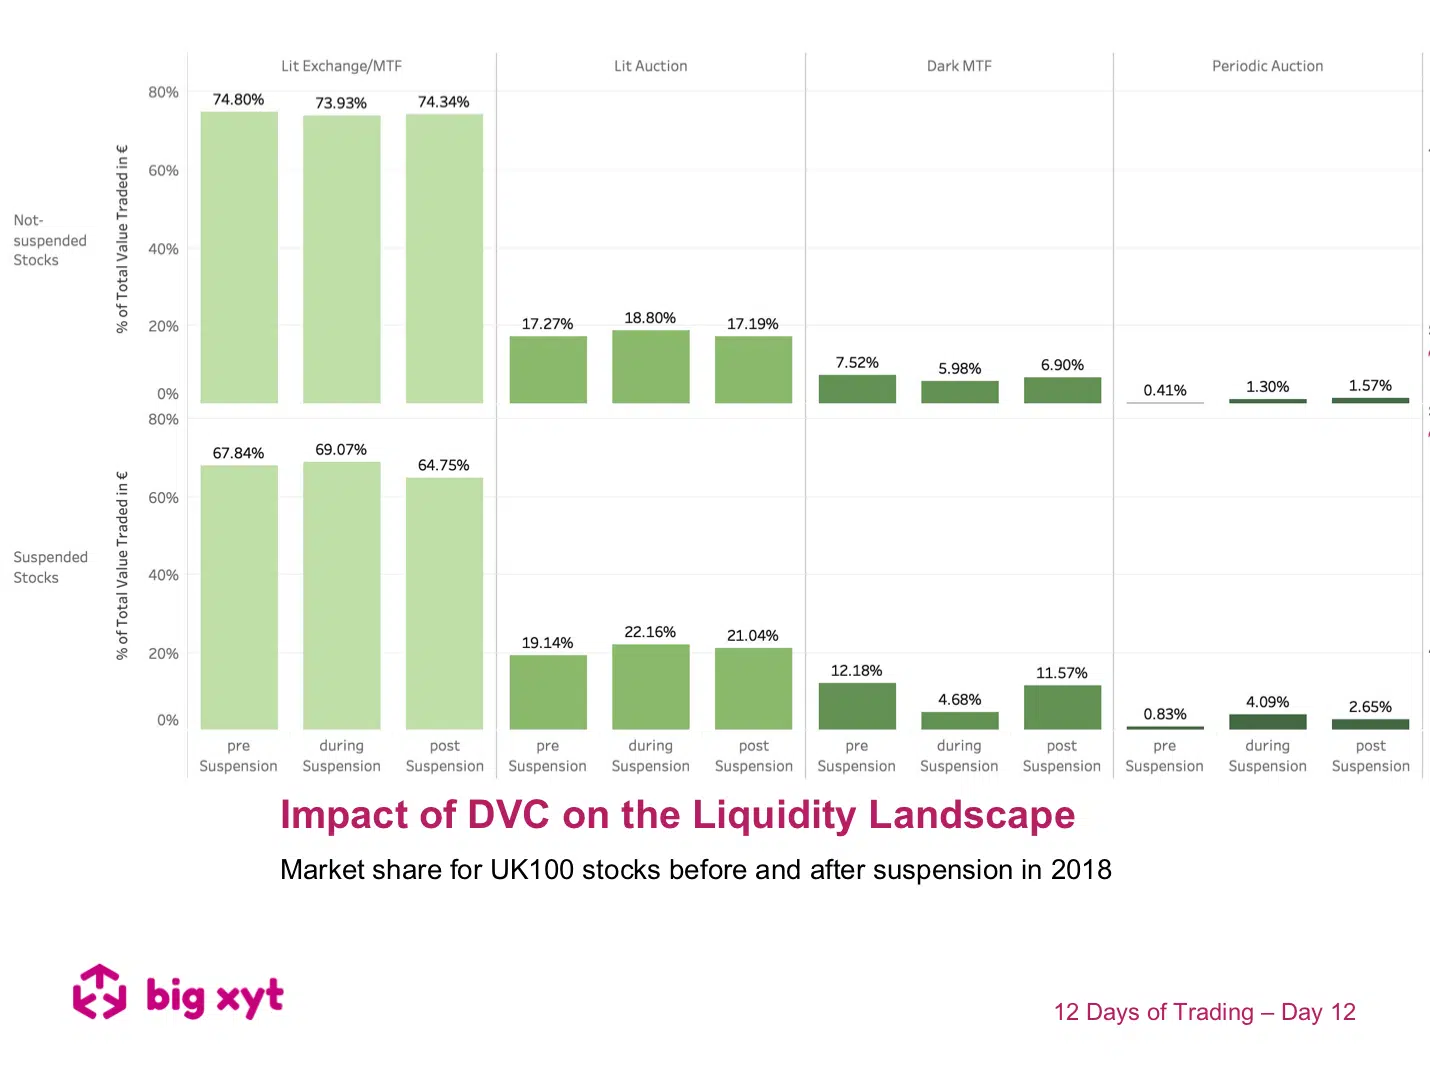
In our final view of the series we return to one of the most controversial MiFID II introductions, Double Volume Caps, with a different attempt to assess their impact by examining how UK blue chip volume dispersed before during and after DVC suspensions. As an explanation for the methodology used for this exercise, in slide one we look at market share before during and after the DVC suspensions. The second slide looks at market share change. The baseline for the calculation is market share before suspension. Some observations: By definition, stocks that were not suspended trade less in the dark and possibly are less liquid in general. Therefore they trade more on Central Limit Order Books and less in Auctions and naturally, Dark Pools. Behavioural change may be in evidence as alternative mechanisms (auctions in particular) appear to maintain and grow their share post-suspension vs pre-suspension.
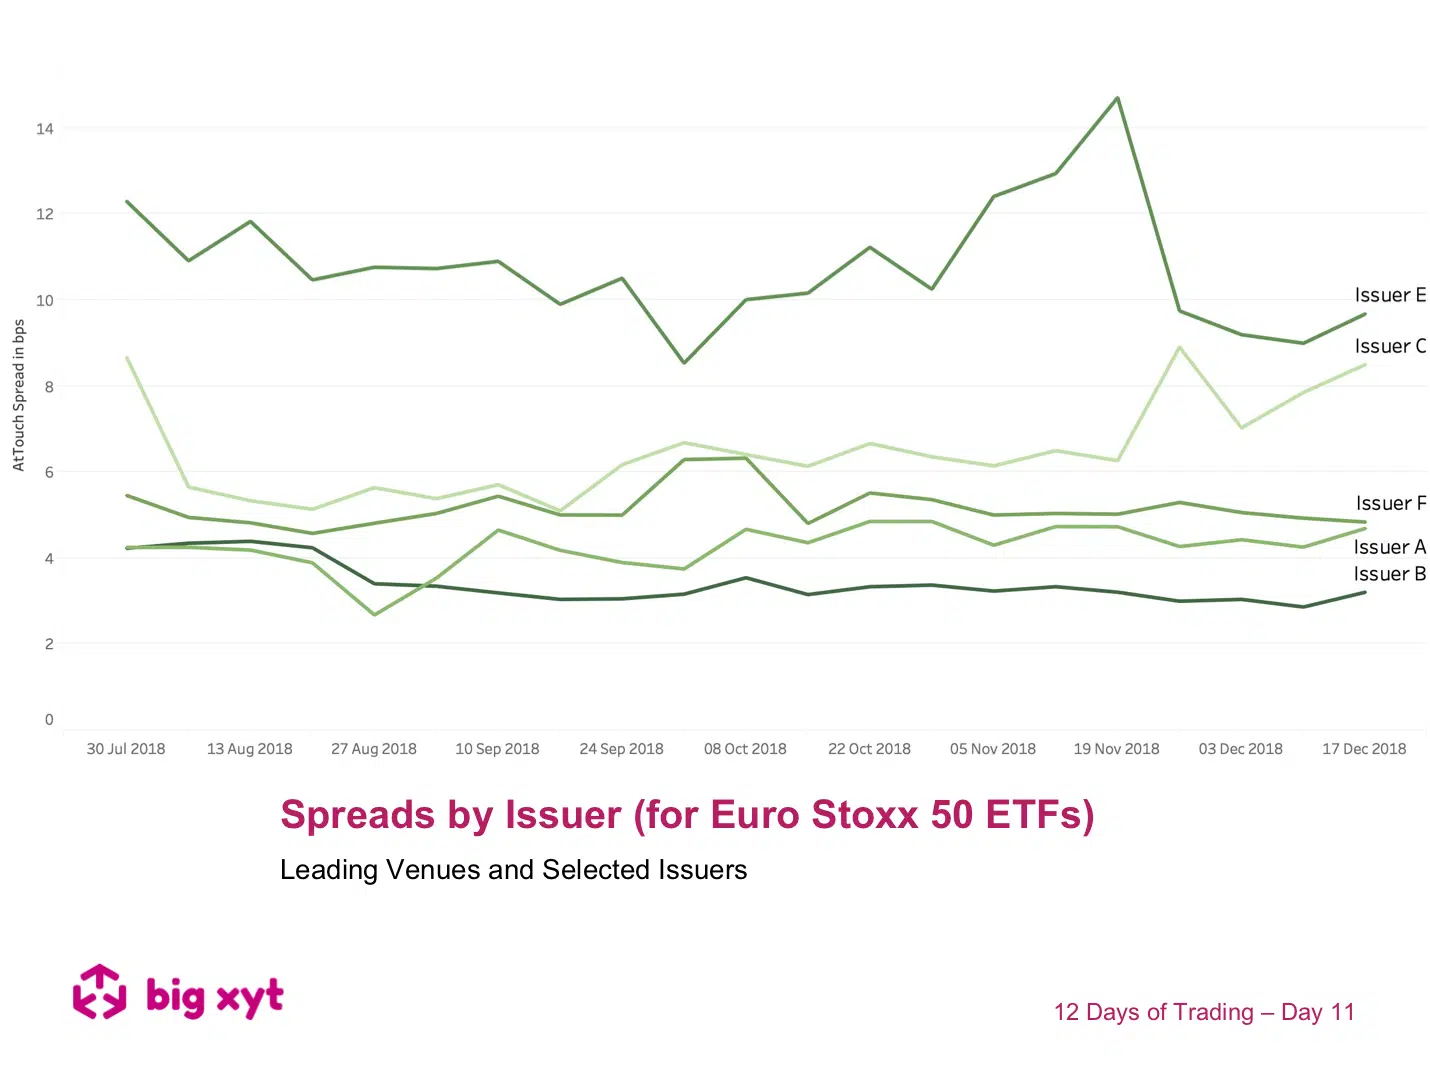
12 Days of Trading – Day 11 of 12: ETF Spreads by Issuer Day 11 of 12: ETF Spreads by Issuer Another comparative way to look at ETF spreads is by issuer. For today’s review the issuer names are anonymised (issuers A to F), but consistent across both charts. In the 2 charts today, we can see the choice facing investors when looking to trade an ETF representing a particular underlying benchmark. Whilst many issuers compete in the same space, there can be quite difference in spreads (& available liquidity) depending on issuer and benchmark.
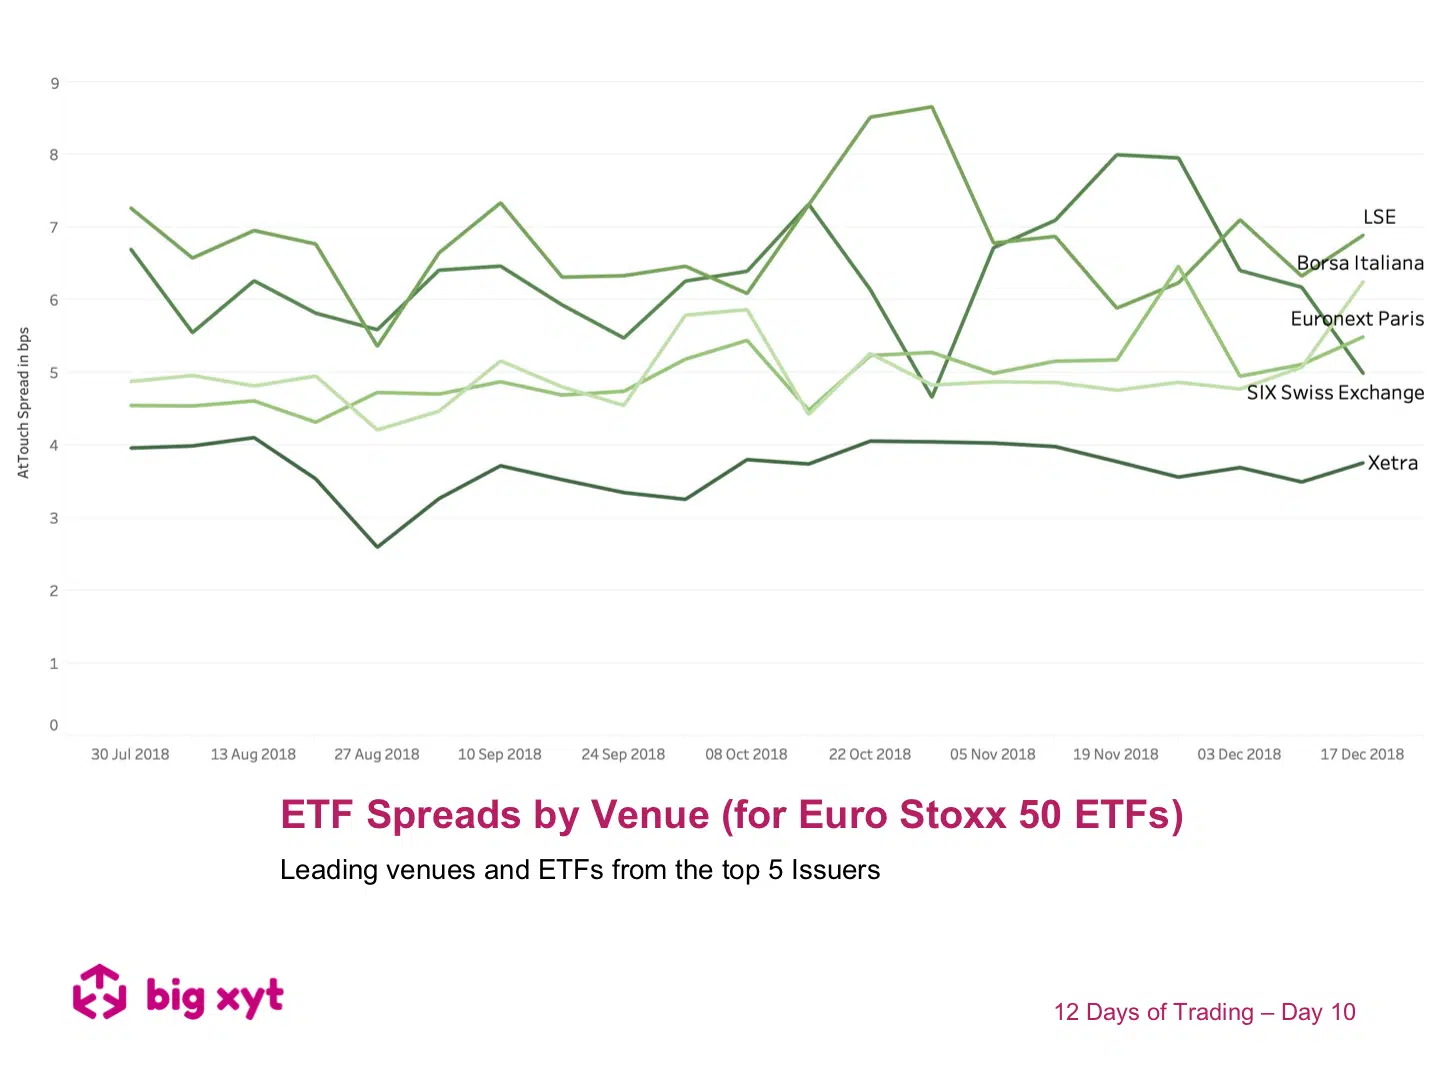
12 Days of Trading – Day 10 of 12: ETF Spreads by Venue Day 10 of 12: ETF Spreads by Venue From our consolidated view of lit markets in ETFs, it is not surprising to see that At Touch Spreads vary by venue. However, looking at the second chart, it would seem wise for the end investor to be aware of where the underlying constituents are quoted. In other words liquidity in ETFs can depend on where they are quoted just as much as the constituents of the underlying basket they are representing.
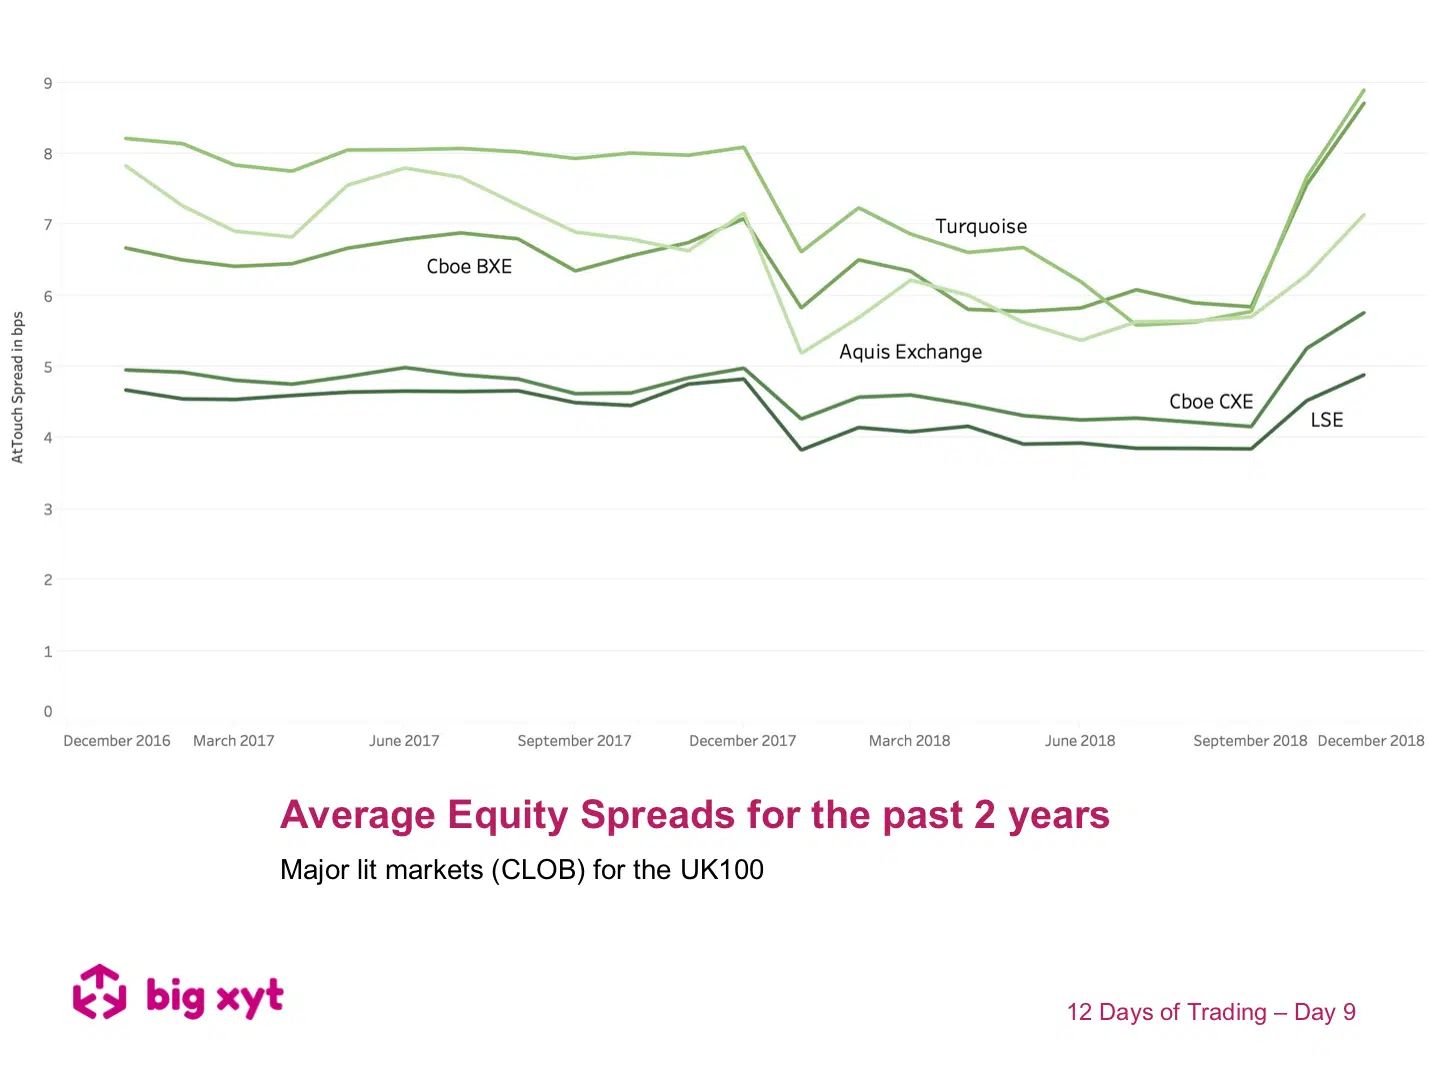
The chart shows at touch time-weighted average spreads for blue chip UK stocks since December 2016 Some observations: There was observed impact of MiFID II with a new tick size regime and an increasingly competitive market. The influence of macro-economic uncertainty on volatility during February 2018 and Q4 2018. It is possible to look at Presence in parallel with spreads to establish how often a given venue has the best price either uniquely or along with other venues – an important measure when considering PBBO or EBBO referencing or other benchmarking. — Do you want to receive future updates directly via email? Use the following
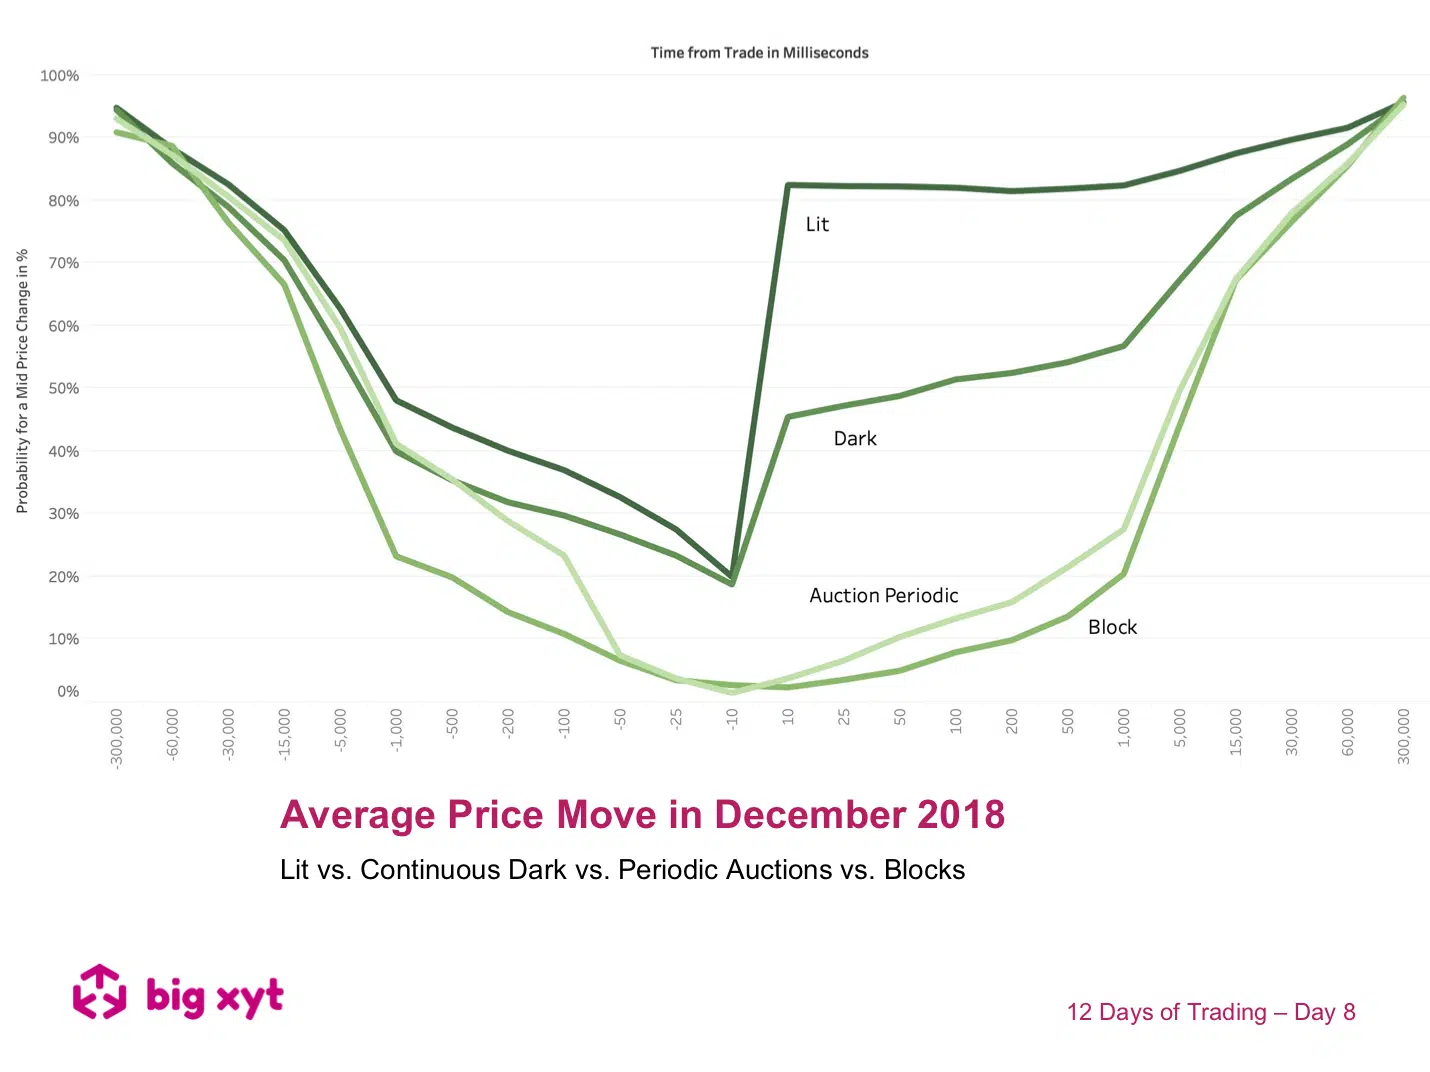
Day 8 of 12: Price movement as a proxy for market impact – A ripple before as well as after the pebble hits the water Measuring the movement of mid point prices before and after the time of every execution allows us to see some interesting patterns emerge. Some observations: Different execution mechanisms exhibit distinct trajectories. The patterns for lit markets, dark pools and blocks have been known for some time. Where do Periodic Auctions fit in? Up to 100 ms ahead of the trade, Periodic Auctions show a similar probability for a market move as Dark Pools. Closer to the execution time as well as after the trade, the probability for a price movement is very low and close to blocks (LIS). — Do you want to receive future updates directly via email? Use the following
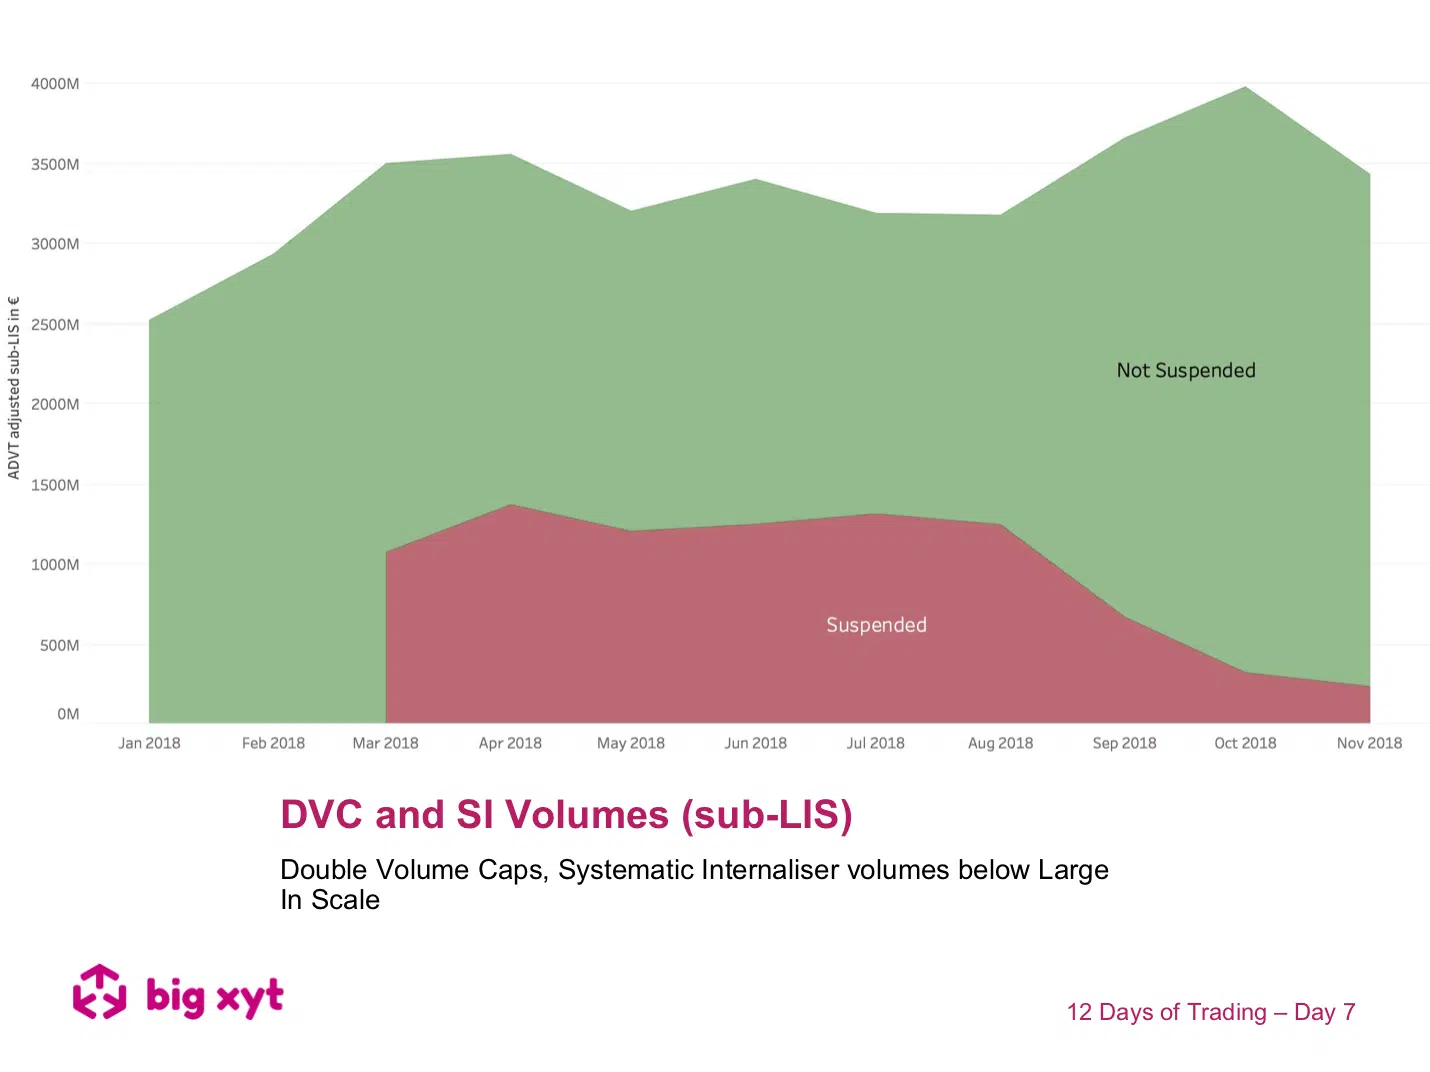
Day 7 of 12: Today we look further at SI volumes to see if the imposition of Double Volume Caps resulted in any observable change in Systematic Internaliser volumes either above or below Large In Scale (LIS) As shown yesterday Pan European average reported volumes by Systematic Internalisers now total around €30bn per day. Of this SI volume, approximately 50{a77189467baebe99d0d59363c4c17c76ac761b303fd809242b1d06b2b931be6c} can be removed by identifying condition codes or trade flags that indicate the transaction was non-price-forming. If we then identify trades reported outside market hours, we are left with a further reduction. Today’s charts provide a further breakdown of adjusted SI volumes, i.e. excluding non-price-forming condition codes and ignoring trades reported outside market hours. Some observations:
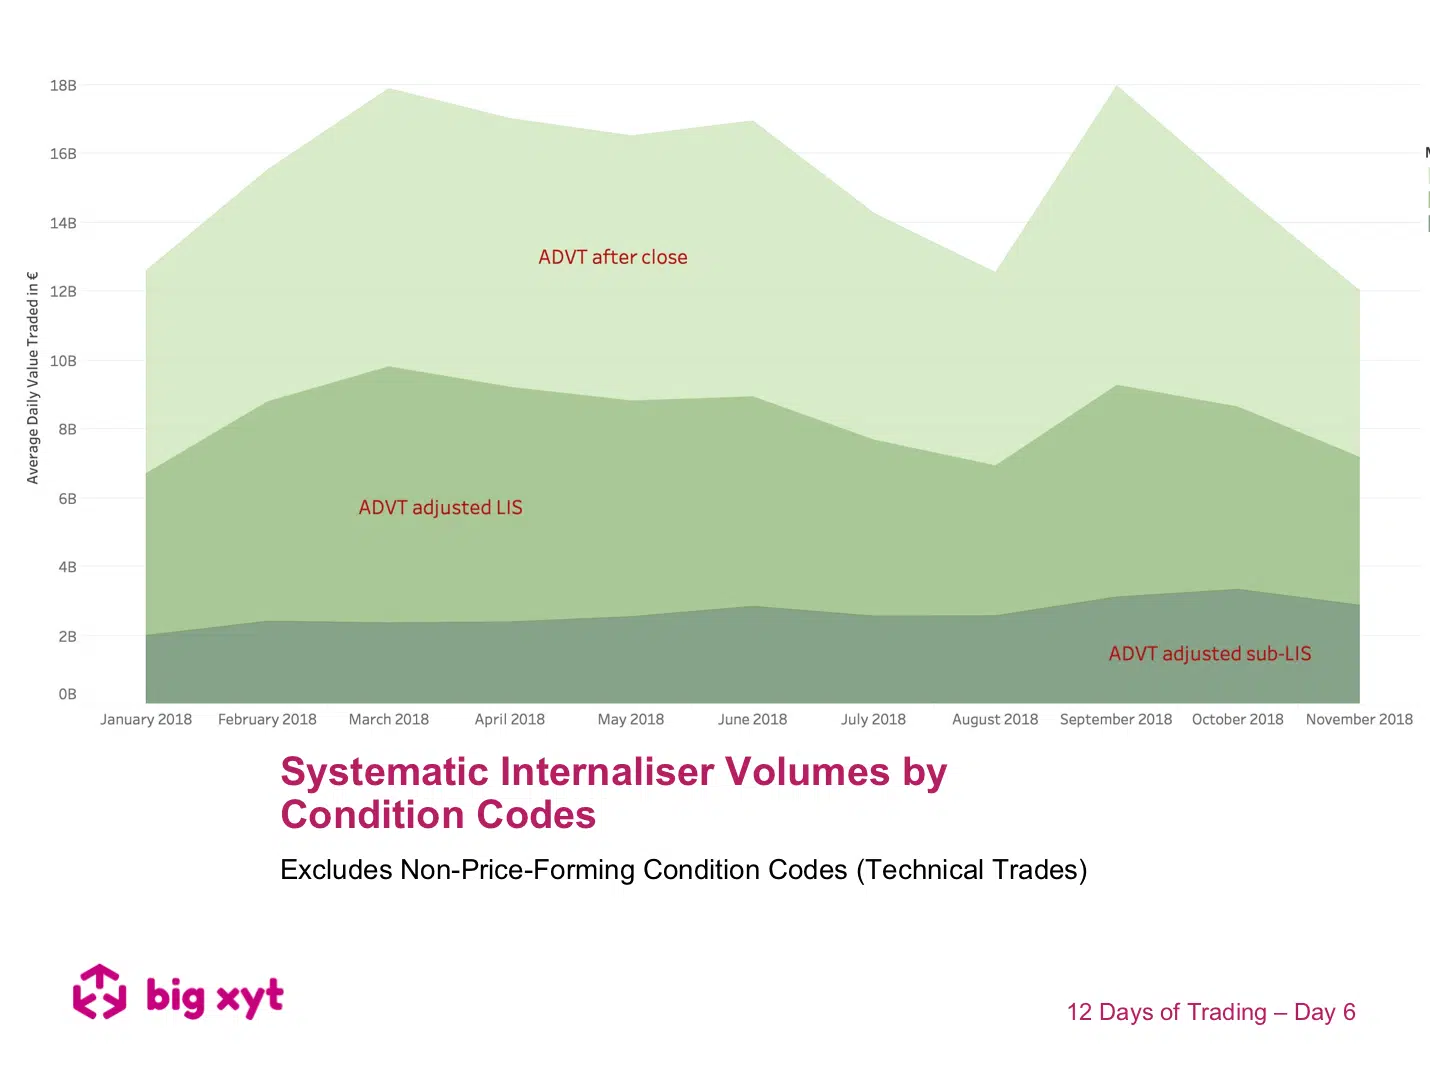
12 Days of Trading – Day 6 of 12: Systematic Internaliser Volumes Day 6 of 12: Breaking Down Systematic Internaliser Volumes by Condition Codes Some observations: Pan European average reported volumes by Systematic Internalisers now total around €30bn, representing 30% of equity turnover. Of this SI volume, approximately 50% can be removed by identifying condition codes or trade flags that indicate the transaction was non-price-forming ( we can provide a long list of these that we have identified for exclusion). If we then identify trades reported outside market hours, we are left with a further reduction (see chart). Many observers see Large In Scale trades reported by Systematic Internalisers as representative of a bilateral negotiation and therefore not representative of liquidity available to all at that price.
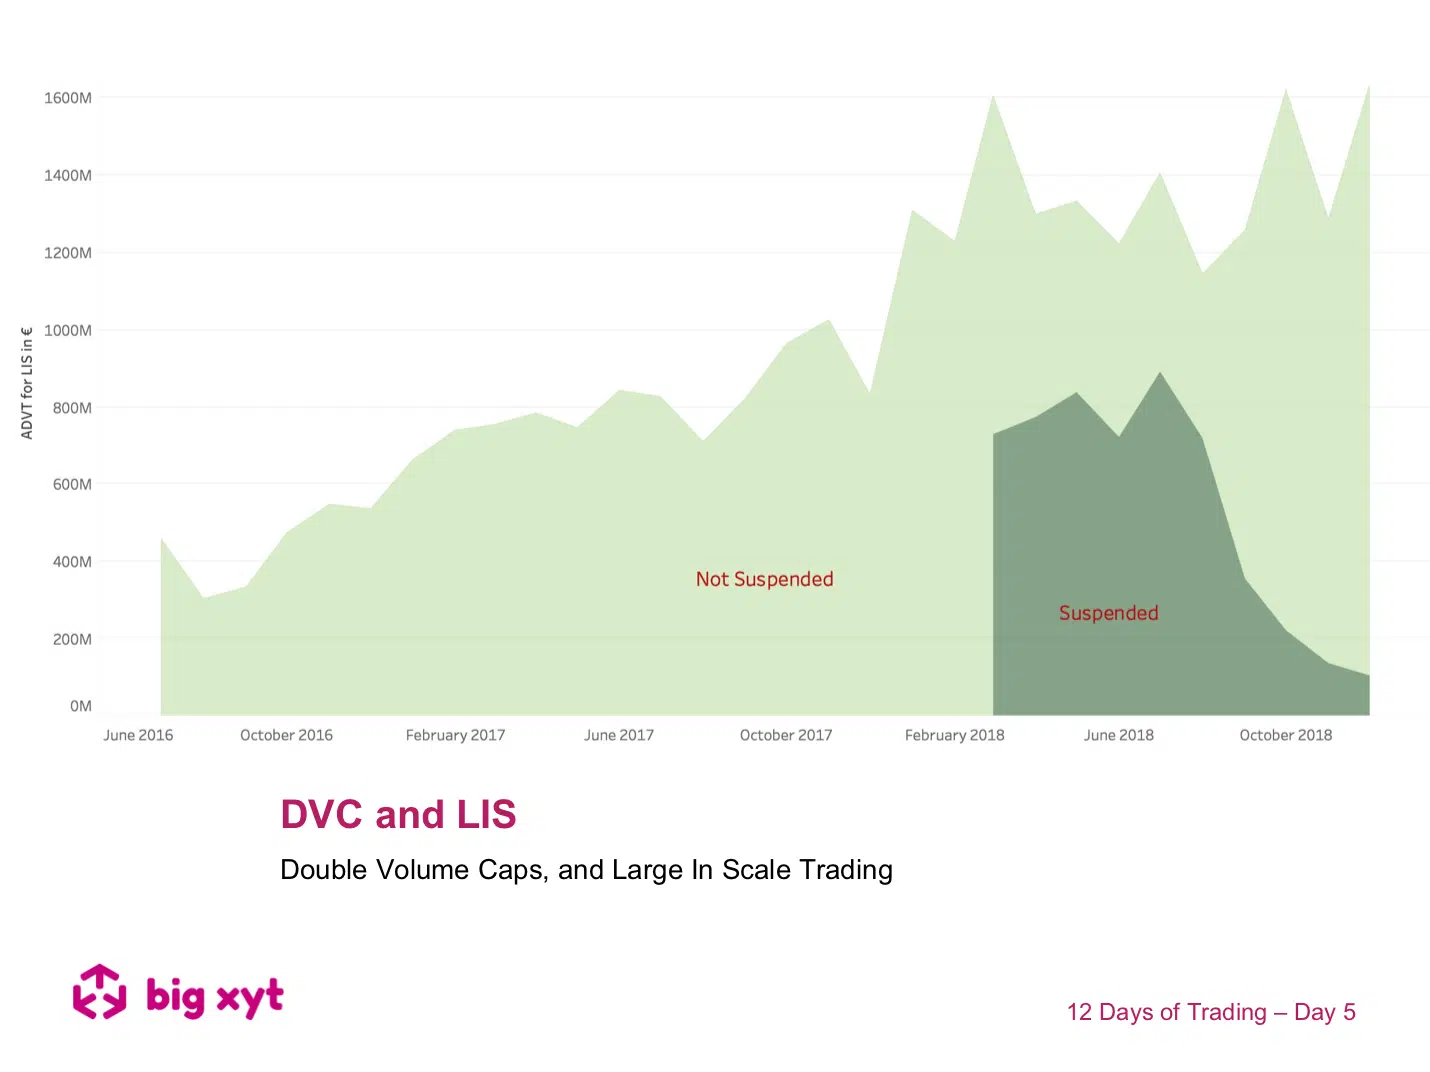
Day 5 of 12: As mentioned yesterday, block trading, represented by Large In Scale (LIS) executions, has been growing steadily over the last 2 years. Some observations: Trading behaviour has adapted to seek out blocks and advances in technology have created better tools to identify and match block trading opportunities. This is illustrated by the chart which seems to infer a greater appetite for block trading whilst DVC suspensions were in place and then a continued acceleration when the suspensions ceased. This surprised some observers who expected the jump in block volumes to be temporary as dark pools regained lost ground. In the second slide today we show the top 10 stocks trading LIS in the dark over the course of the year:
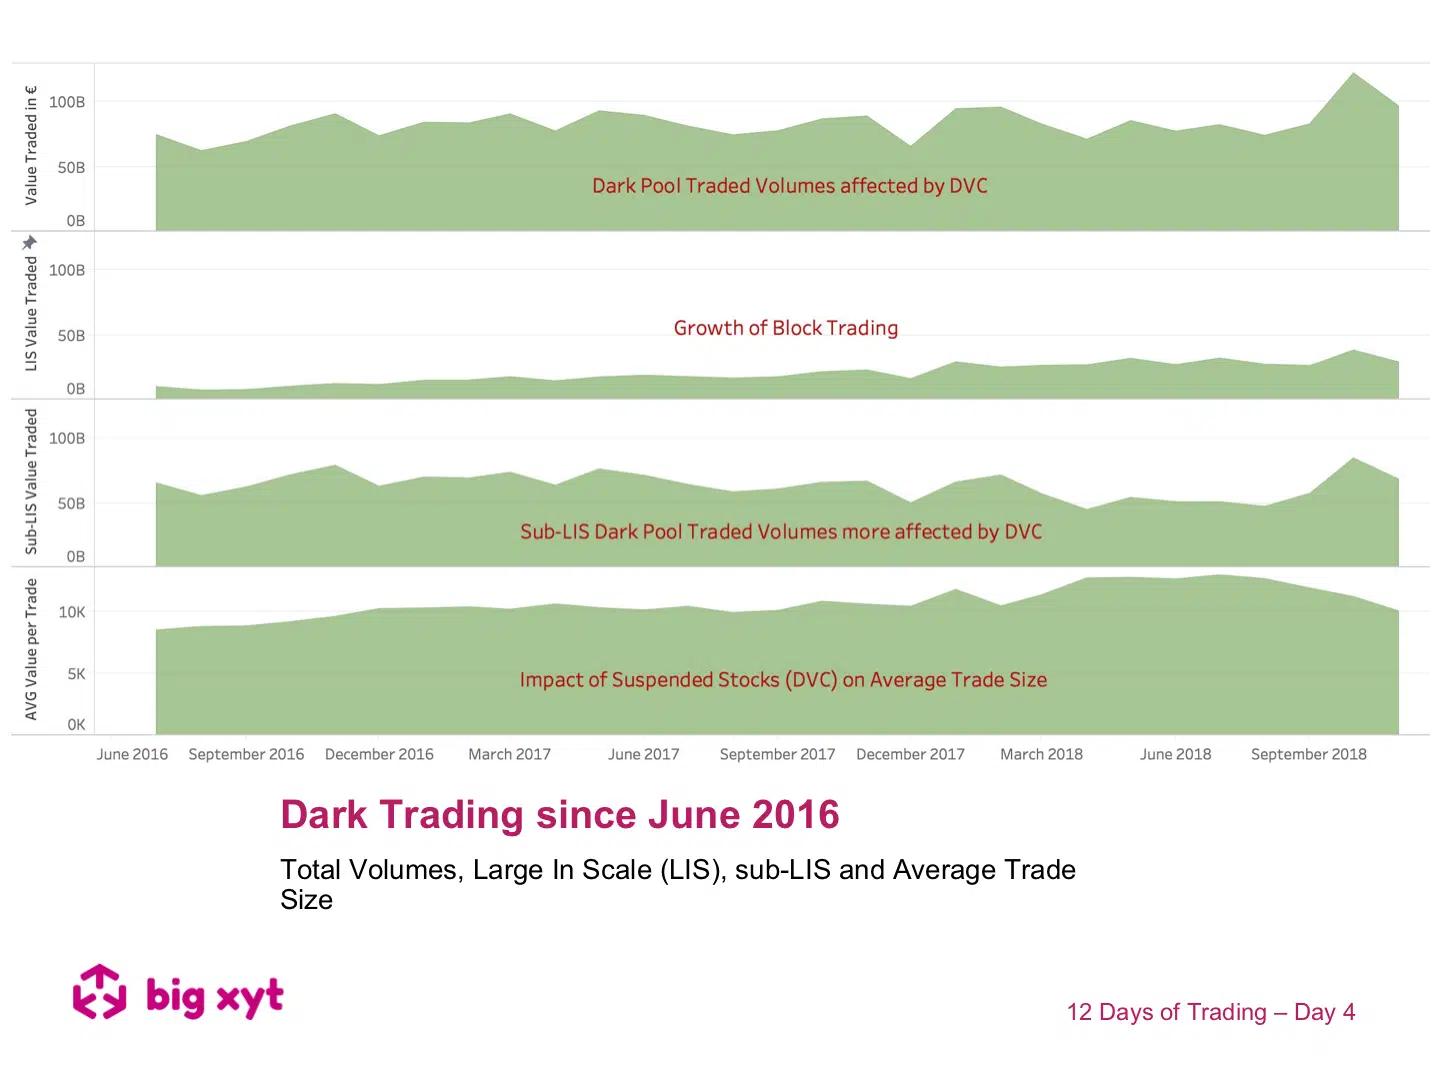
12 Days of Trading – Day 4 of 12: Dark Trading since June 2016 Day 4 of 12: In today’s view we take a look at some evolutionary themes in European Equity dark and block trading over the last 2 years. Some observations: As expected, DVCs had an impact on dark traded volumes particularly in trades below Large In Scale (LIS). In fact this reduction in sub-LIS during the DVCs resulted in average trade sizes temporarily increasing. Block trading represented by Large In Scale trades has continued to grow during the period and is something we look at more closely tomorrow. — Do you want to receive future updates directly via email? Use the following
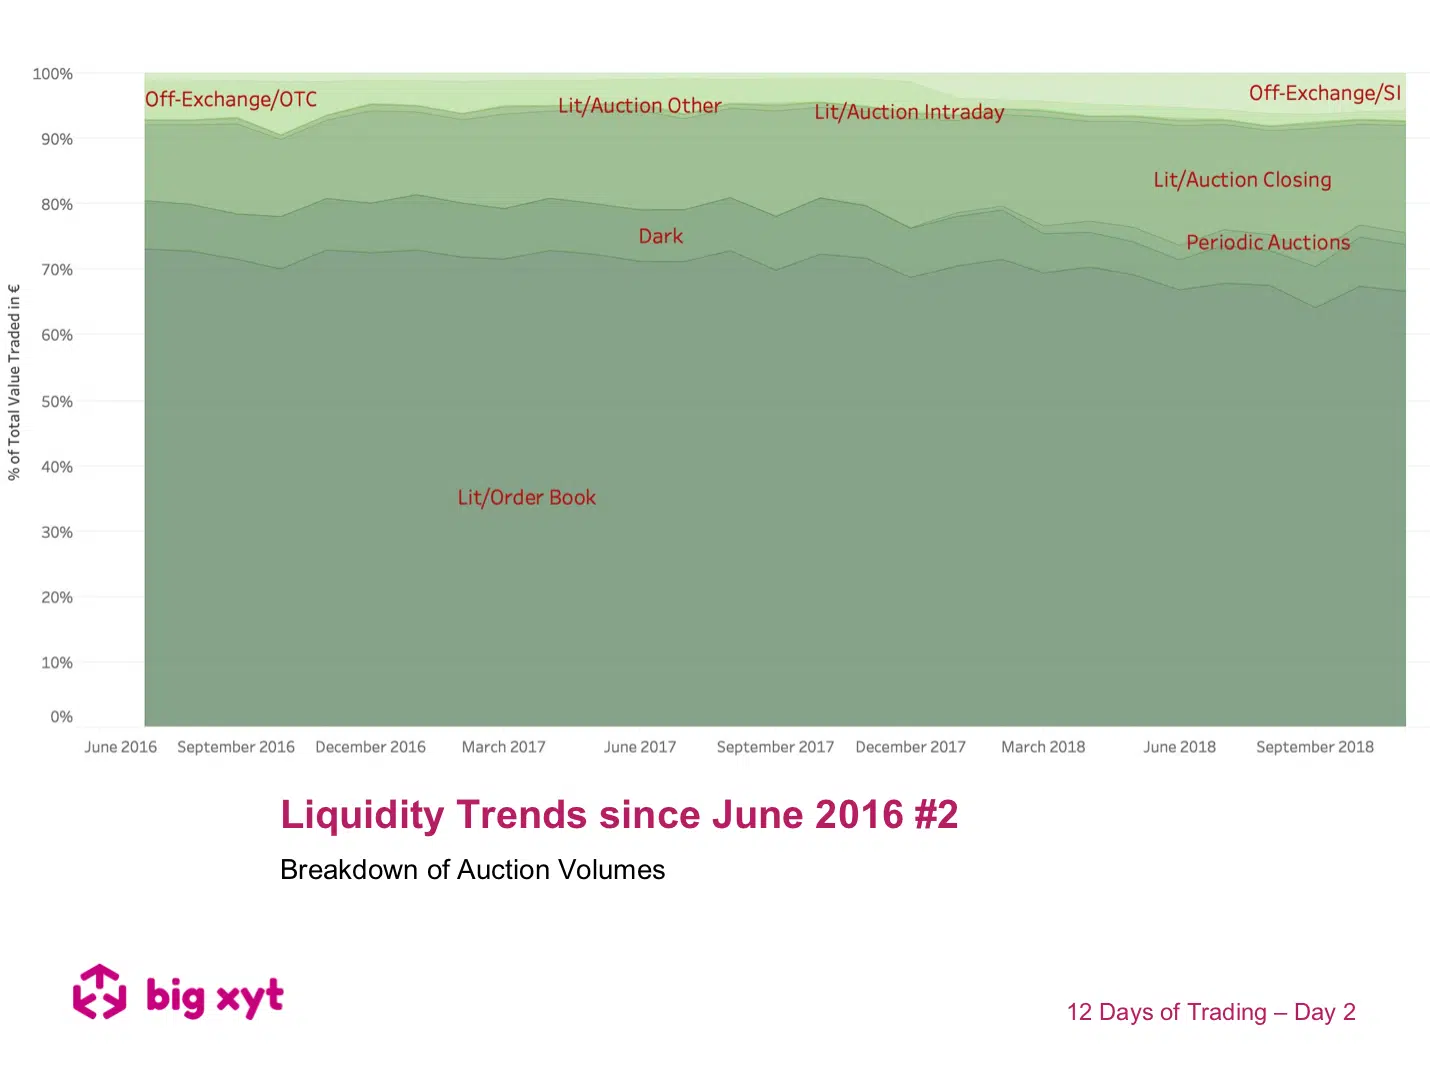
Day 2 of 12: After our initial market overview yesterday, today we take closer look at the development of auctions. Some observations: The two largest gainers appear to be the Closing Auctions and Periodic Auctions. Some have observed that more lit trading has moved to the closing auction as the benchmark drives index & ETF traders. The inference then for Periodic Auctions is that they have seen flow migrate from dark pools as Double Volume Caps took effect. It is difficult to be certain of the reasons for this dispersion from this chart alone so we plan to investigate further in subsequent days. — Do you want to receive future updates directly via email? Use the following form to subscribe. On our 12 Days of Trading As the year draws to a close we have been asked by clients to look and highlight 2018 trends since the introduction of MiFID II. We thought we might make this a festive exercise on the 12 days leading up to the holidays. As a result, you will find a post to a different 2018 big-xyt observation each day.