
After our first post of this series where we highlighted three stocks with large price reversion before and after the close on 30th November, we had several enquiries asking if we have an easy way to identify these moves. When using data analytics to support trading decisions, one can try to gain an insight from a snapshot of information to simplify something complex or often, more valuably, to identify a trend or pattern. Either way it is like a game of I Spy.

After a traumatic 12 months, we thought you might be feeling a little bristly in the lead up to the holidays. What better way to complement the mood than by looking at the impressive volume spikes of 2020. We’ve put together A Hall of Fame for those days over the last four years where traded value has exceeded 100 billion euros. The trophy for the highest number of days – 15 – sits securely on 2020’s mantelpiece, and the overall winner is February 28th, with a traded value of 132 billion euros. In a broader context, that means that 15 out of the 21 days were in 2020, including 10 out of the 17 days between February 28th and March 20th.

In the past we have commented about the dangers of trading at the Close on days when there are significant trading volumes expected. Last week’s MSCI rebalance showed us new examples of the dangers. Taking the official close as a stick in the sand, we calculated the volume weighted average price (VWAP – excluding the Close) as a proxy for an “average price” that might have been achieved by trading in the continuous market. We compared this to the official Closing price to identify large differences representing significant opportunities for profit or loss depending on whether you were on the “right’ or “wrong” side of the trade. For many stocks, these auctions resulted in significantly higher volumes of trading than the average total daily volume, not just the average closing turnover. That extra size traded magnifies the extent of the P&L.

Last month we touched on the growing number of Alternative Closing Mechanisms available to the equity trading community as we added the new Turquoise Plato Trading at Last to our Enterprise menu. Within a few days we saw that Deutsche Bourse were introducing Xetra Trade-at-Close, and last week we added this to the menu. With the MSCI rebalance yesterday, all eyes will have been on the closing prints..….but which Close? To sign up for a free trial of the

Our very own Mark Montgomery took part in Harrington Starr‘s second installment of The Fintech Focus TV Debate Series, alongside Steve Grob of Vision57, Mike Powell of Rapid Addition Limited, Jon Butler of Velox, and Reena Raichura of Glue42, to discuss changes in the FinTech space. “People are concerned with transference of data – at big xyt you don’t need to transfer your data to us; we can independently benchmark your trades by you interrogating the data through our API for the results that you are looking for. If you can independently source the information, and you can create your own reports, we don’t need to tell you what benchmarks to use, or what analysis to do. That’s up to you!”

A sudden recovery in trading volumes in the energy sector is just what we would have expected from the news of the vaccine last week, and it’s in line with the broader market. The news may only be a light on the horizon, but a return to normal levels of trading activity will show that investors are returning to the stage. The bubble chart shows the relative difference between each share’s average daily volume per month versus the average daily volume for the whole period, beginning in October 2019. The size of the bubble shows the average daily volume in euros for each month. For example, a normal range for Royal Dutch Shell Plc is around 800M€ to 1050M€ per day.

New York, London, Frankfurt, November 9th 2020 – big xyt, the independent provider of market data analytics and smart data solutions, is pleased to announce Jenny Chen has joined their executive team as Managing Director, Head of Sales in the Americas. Jenny will be responsible for accelerating growth in the US and supporting clients in leveraging big xyt solutions to transform their trading performance and analysis. Based in New York, Jenny joins big xyt from Société Générale where she spent eight years as MD, Head of Global Execution Services, overseeing program trading, electronic trading, cash equities, ETF, and futures. Prior to Société Générale she spent seven years at Goldman Sachs and previously UBS.
Checking liquidity data isn’t just something we need to do once a month using a summary report. It is part of the daily routine. Every stock has its own characteristics that can change significantly and surprisingly frequently, and when you are trading in a fragmented world with so many different types of liquidity pool you need to be alert to those changes to obtain the best execution results. Let’s say you’ve been pushing UK mid caps recently and Travis Perkins (TPK) (purveyors of fine building materials to the trades and DIY) has caught your eye. A new branch has opened in your local area and you’ve noticed a long queue outside at the weekends, not to mention Boris’ now regular speeches about building for the future. Several of your clients like the idea and today a nice order for a day’s ADV has landed on your desk like a 100 litre bag of sharp sand. TPK can be illiquid but you’re keen to deliver an execution that’s as smooth as a final skim. You are tempted to follow your instincts and leave a chunk for the Close while putting a few good size orders into the Conditional venues, but before getting the toolbox out you have a quick look in your big-xyt Liquidity Cockpit.
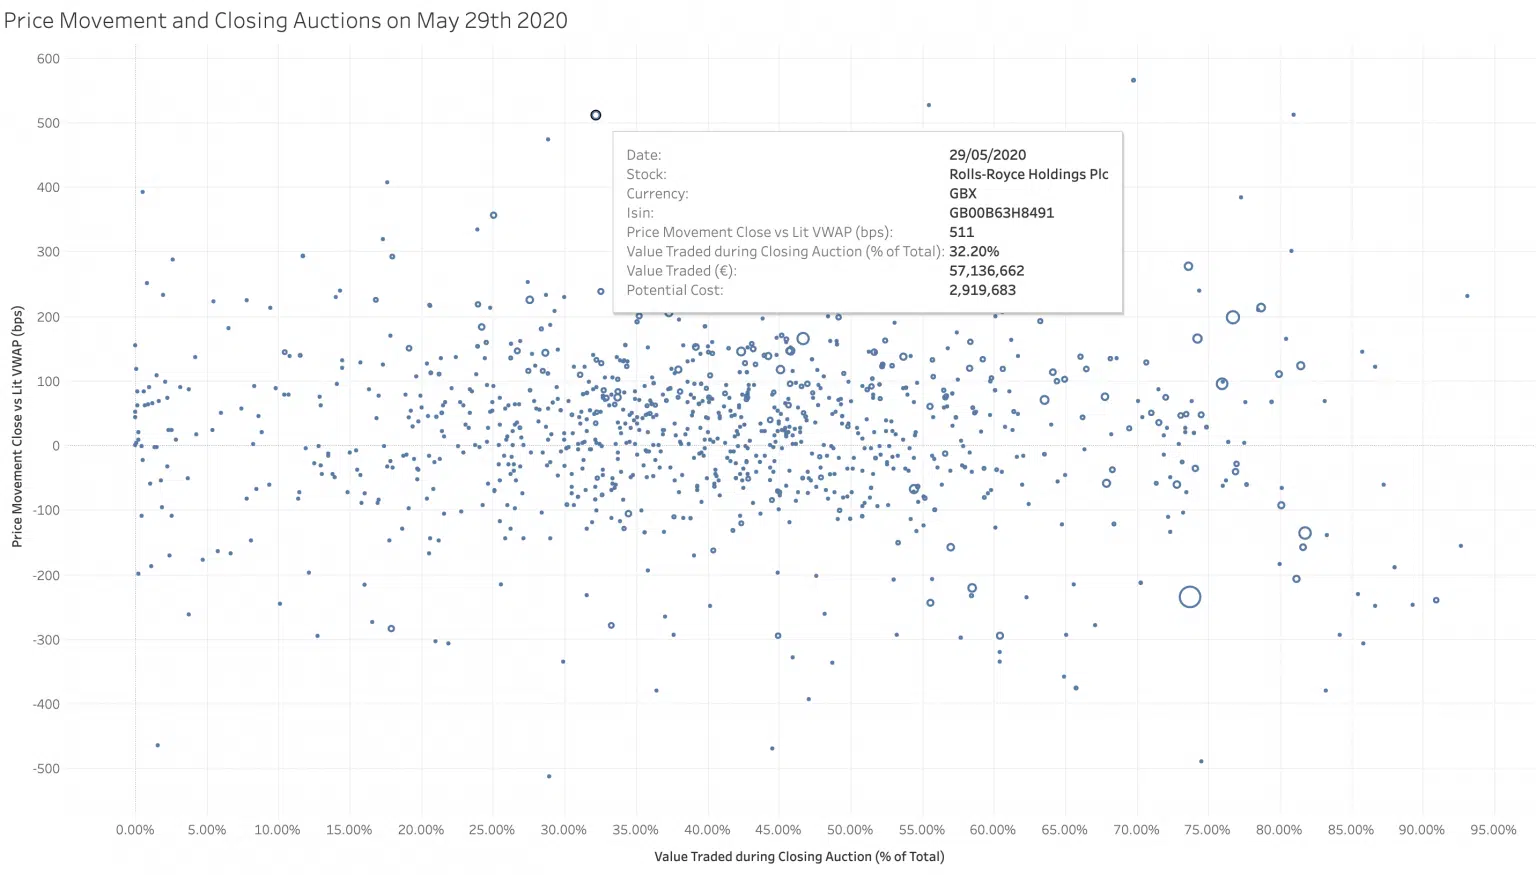
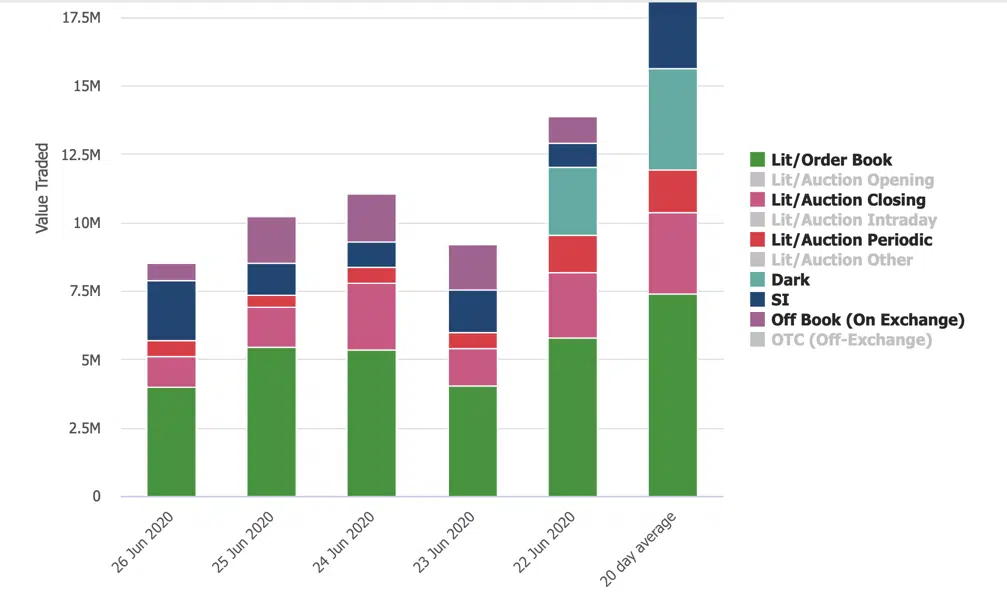
It seems like a good time to leave the days of isolation behind us but fear not, our observations will continue this week. Following on from our previous post, we promised to take a closer look at one of the many outliers from the exceptional closing volumes on 29th May. Rolls Royce struck us as an interesting stand-out (main image above). There was heavy trading ( 32% of the daily turnover) at the close, although as far as we are aware, it was not an index addition or deletion on the day, The value traded was five times larger than the twenty day average closing volume (See chart below).
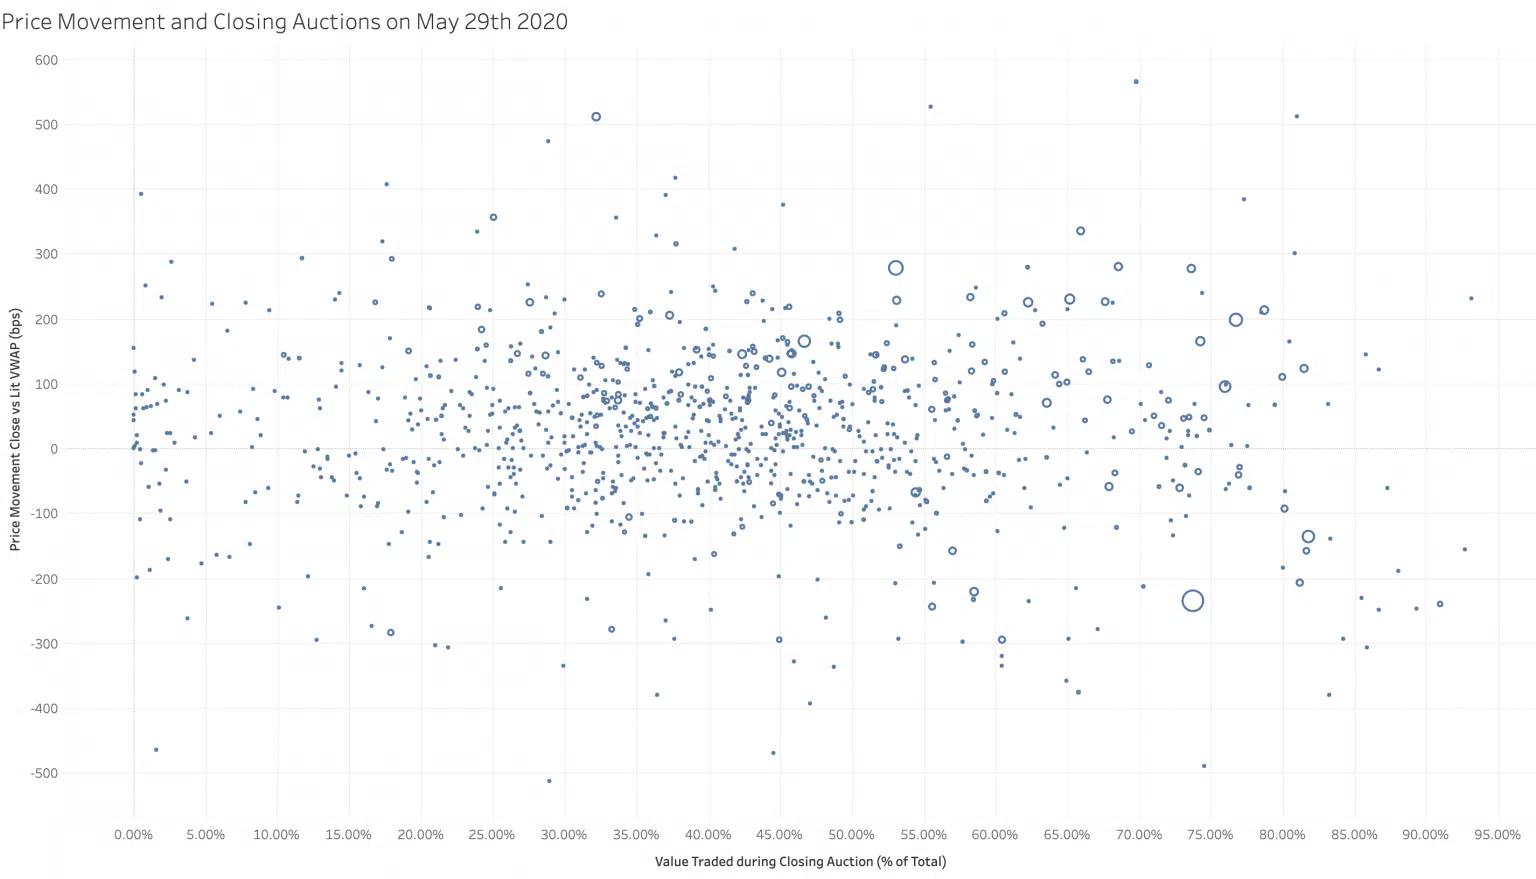
Some of you may have been straining your eyes looking at the night sky during the recent SpaceX launch. The image above isn’t a photographic negative image of heavenly bodies, it is actually a scatterplot of multiple European stocks. The Y-axis measures the difference between lit intra-day VWAP and closing price versus % daily volume traded at the close on the X-axis. An accurate and well maintained granular financial dataset combined with powerful visualisation tools can be like introducing an amateur astronomer to a powerful new telescope. On 29th May, the day of a large index rebalancing trade, we saw significant increases in volumes traded at the close as mentioned in our post last week. Using scatterplots like this we can see the stocks with the largest percentage of their daily volume in the close, combined with another dimension. This measure shows the difference between the closing price and the full day Volume Weighted Average Price (VWAP) excluding the auction print. Stocks that were announced for addition or deletion do not necessarily show the largest price move during the Closing Auction. Many other stocks are more affected both positively & negatively. On average the stocks selected in this pan-European universe saw a closing price deviation of 1%. That means for the €33bn traded in the closing auction that day, there was a total cost or profit of €300mn depending on whether you were on the right or wrong side of the decision to trade in the auction.