Having a good understanding of how to select a venue when executing a large trade is essential for successful performance. There are many venues to consider and each venue has its own “sweet spot”, depending on the names and size traded and that varies according to your level of urgency. Using objective criteria, such as expected time to execution and likely price impact, we can rank venues into an order of priority for routing. Furthermore, when we look at how this changes over time, we get a sense of the importance of regular monitoring and updating of the smart order routing process.
Having a good understanding of how to select a venue when executing a large trade is essential for successful performance. There are many venues to consider and each venue has its own “sweet spot”, depending on the names and size traded and that varies according to your level of urgency. Using objective criteria, such as expected time to execution and likely price impact, we can rank venues into an order of priority for routing. Furthermore, when we look at how this changes over time, we get a sense of the importance of regular monitoring and updating of the smart order routing process.

The strange times continue. While Q1 broke all the records, Q2 came up with a few surprises. The biggest MSCI rebalance in history pushed the figures up for May, thanks to some major index re-weightings. Volatility returned in June to create the 3rd biggest month since MiFID2 began. In our quarterly review we look at the patterns of volumes and market share and this time we take a closer look inside the box of Systematic Internalisation.
Checking liquidity data isn’t just something we need to do once a month using a summary report. It is part of the daily routine. Every stock has its own characteristics that can change significantly and surprisingly frequently, and when you are trading in a fragmented world with so many different types of liquidity pool you need to be alert to those changes to obtain the best execution results. Let’s say you’ve been pushing UK mid caps recently and Travis Perkins (TPK) (purveyors of fine building materials to the trades and DIY) has caught your eye. A new branch has opened in your local area and you’ve noticed a long queue outside at the weekends, not to mention Boris’ now regular speeches about building for the future. Several of your clients like the idea and today a nice order for a day’s ADV has landed on your desk like a 100 litre bag of sharp sand. TPK can be illiquid but you’re keen to deliver an execution that’s as smooth as a final skim. You are tempted to follow your instincts and leave a chunk for the Close while putting a few good size orders into the Conditional venues, but before getting the toolbox out you have a quick look in your big-xyt Liquidity Cockpit.
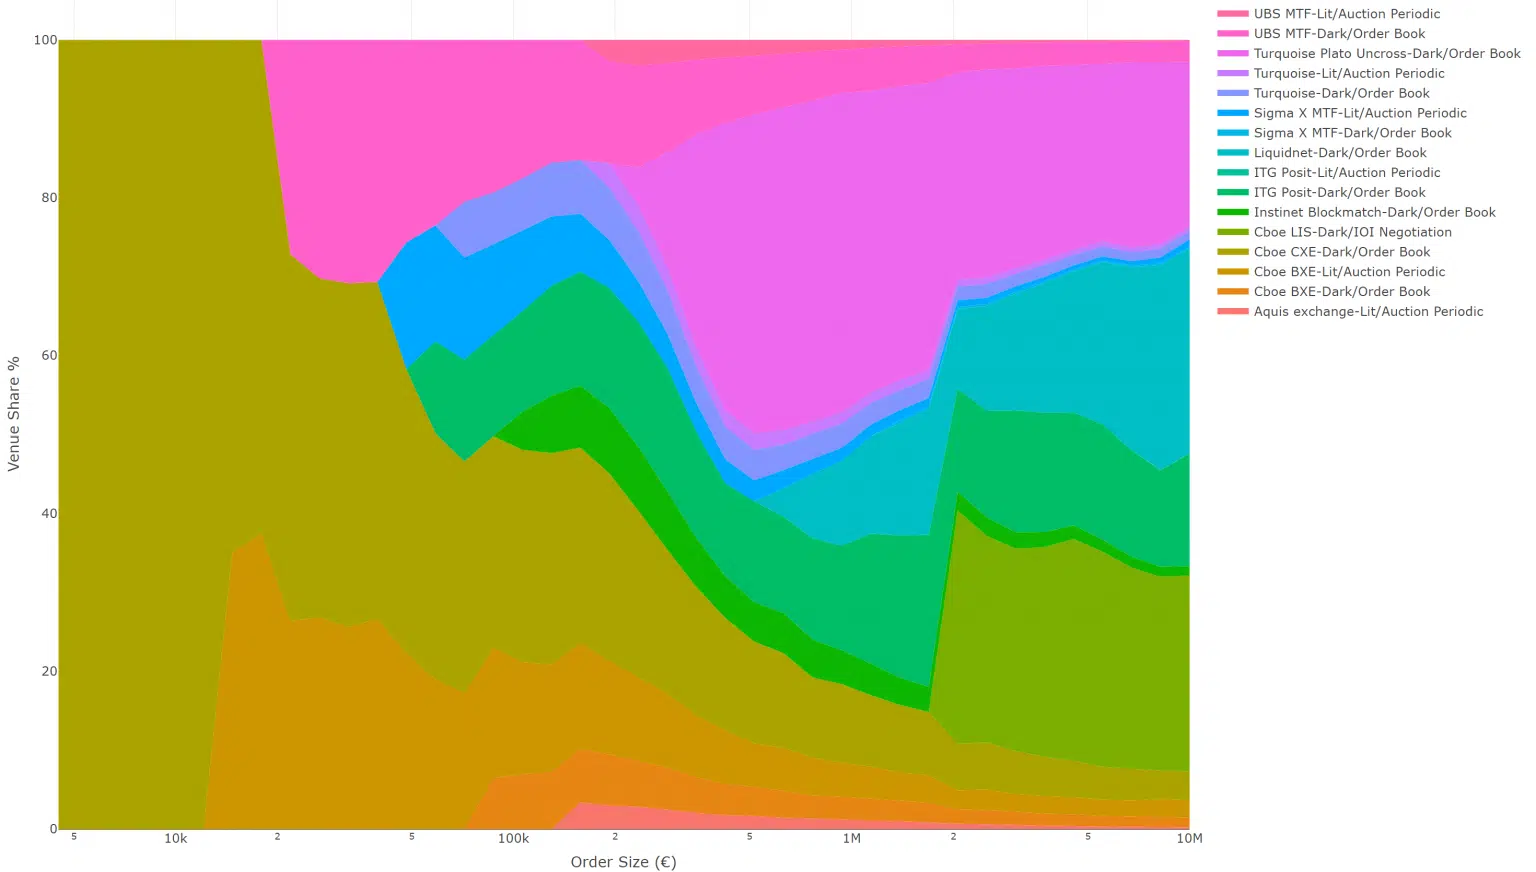
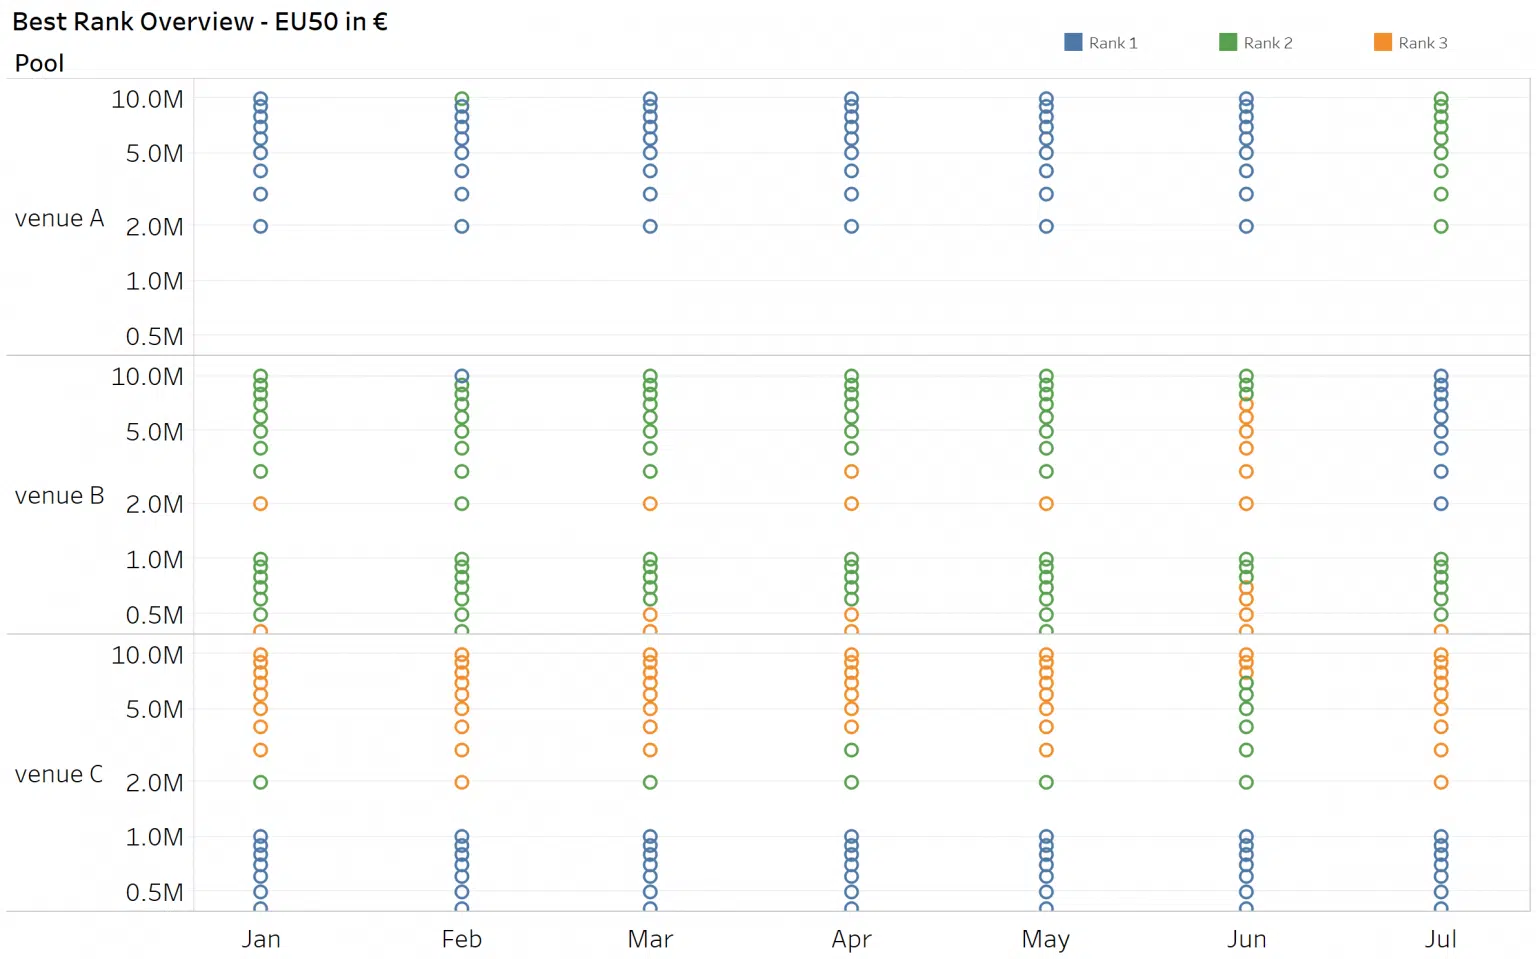
We know that trading behaviour, microstructure and liquidity all vary significantly between venues and across individual stocks. Understanding these differences has become a very important prerequisite to any market participant. Armed with this knowledge, traders can substantially reduce their execution costs, product managers can design better strategies and trading venues can improve their liquidity sourcing. Traders and practitioners are always faced with the question of which venues to pick and how to rank them. The answer to that question is a little more complex than initially thought and the best short answer one can give is: well, it depends. We know that each venue has three important factors that influence the ranking: the speed of execution (or the number of trades per day); the distribution of order sizes and price improvement which measures the implicit costs of trading in the venue. These are all objective measures that can be approximated from public data.
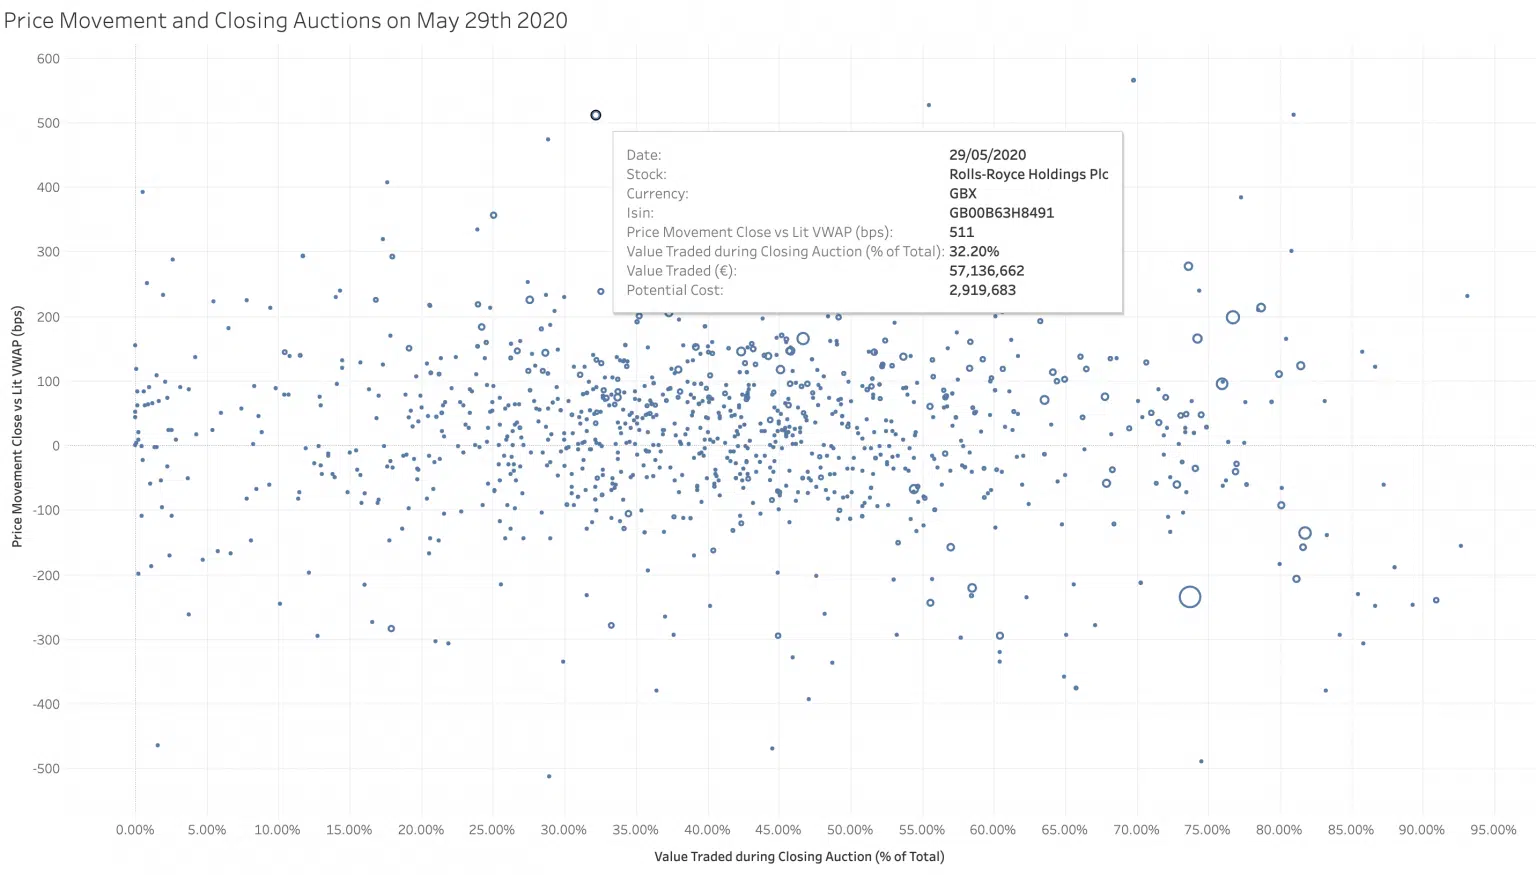
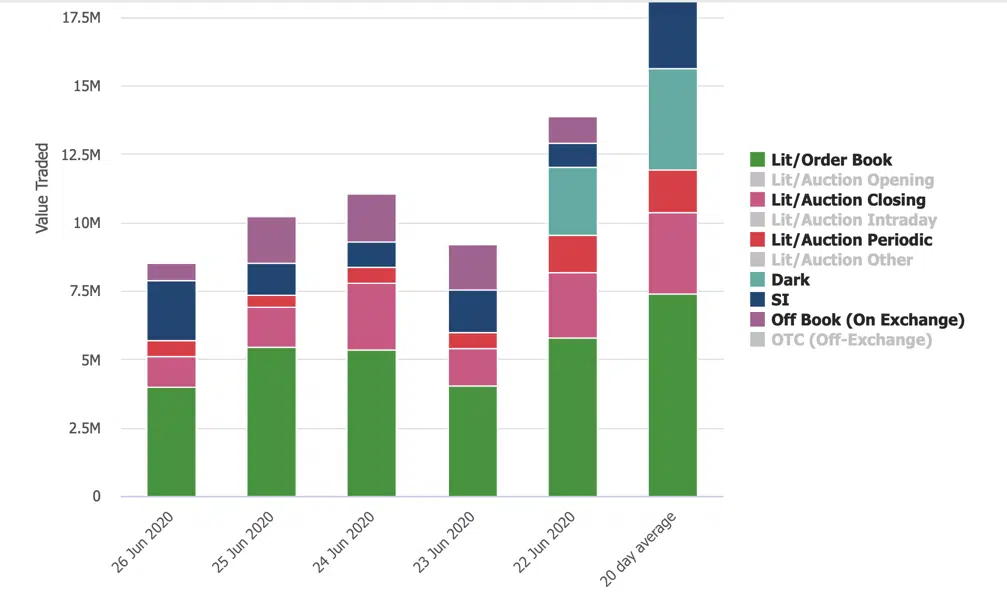
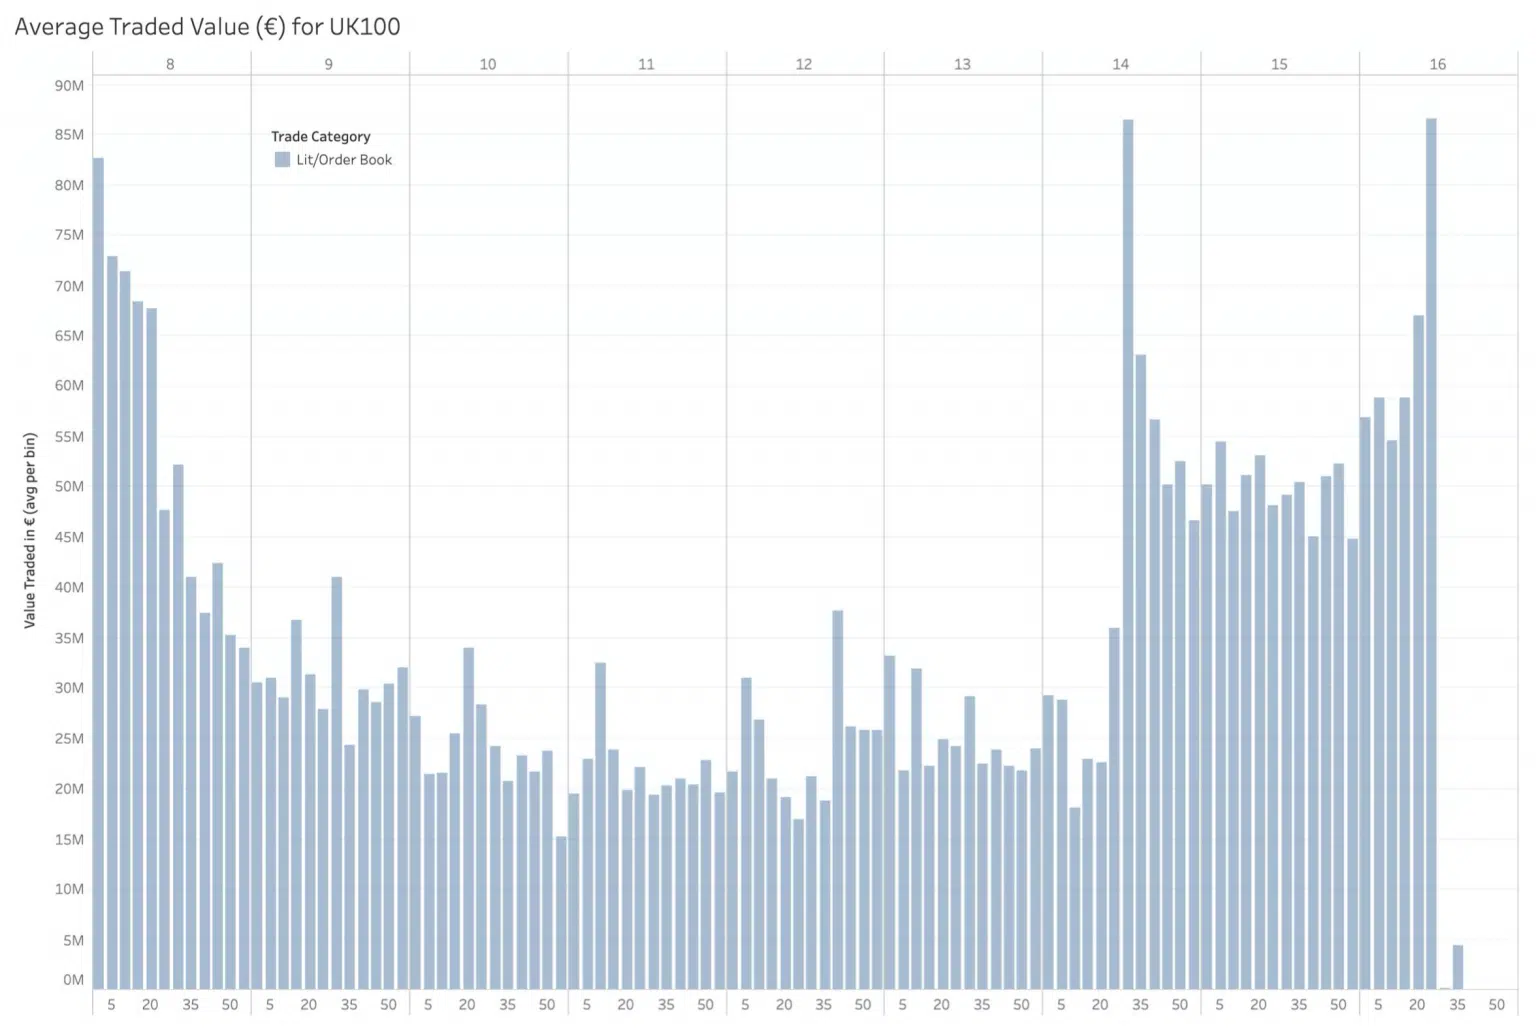
It seems like a good time to leave the days of isolation behind us but fear not, our observations will continue this week. Following on from our previous post, we promised to take a closer look at one of the many outliers from the exceptional closing volumes on 29th May. Rolls Royce struck us as an interesting stand-out (main image above). There was heavy trading ( 32% of the daily turnover) at the close, although as far as we are aware, it was not an index addition or deletion on the day, The value traded was five times larger than the twenty day average closing volume (See chart below).
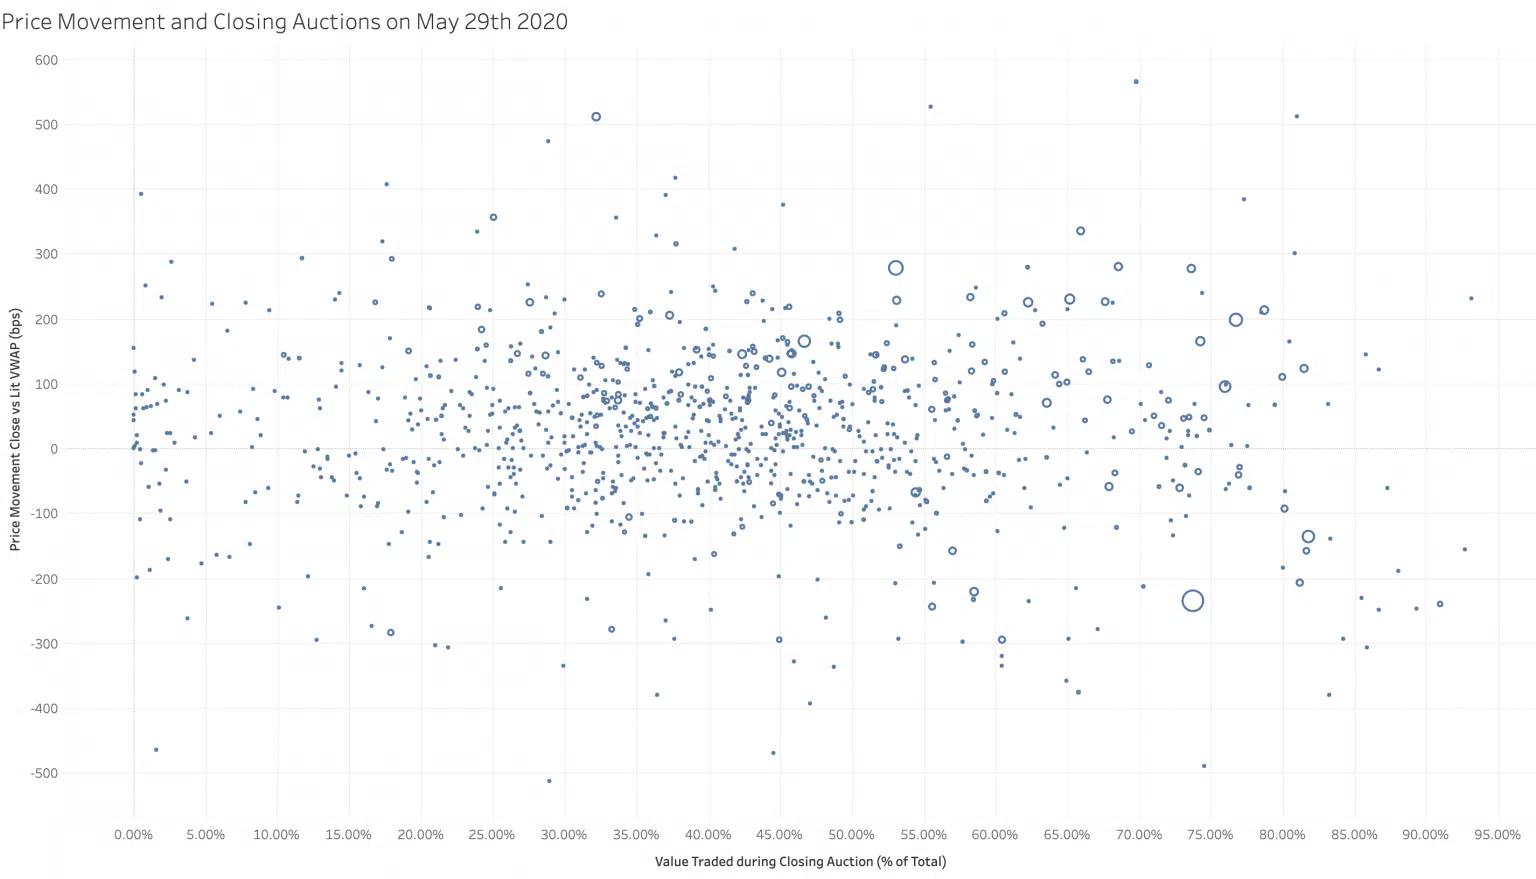
Some of you may have been straining your eyes looking at the night sky during the recent SpaceX launch. The image above isn’t a photographic negative image of heavenly bodies, it is actually a scatterplot of multiple European stocks. The Y-axis measures the difference between lit intra-day VWAP and closing price versus % daily volume traded at the close on the X-axis. An accurate and well maintained granular financial dataset combined with powerful visualisation tools can be like introducing an amateur astronomer to a powerful new telescope. On 29th May, the day of a large index rebalancing trade, we saw significant increases in volumes traded at the close as mentioned in our post last week. Using scatterplots like this we can see the stocks with the largest percentage of their daily volume in the close, combined with another dimension. This measure shows the difference between the closing price and the full day Volume Weighted Average Price (VWAP) excluding the auction print. Stocks that were announced for addition or deletion do not necessarily show the largest price move during the Closing Auction. Many other stocks are more affected both positively & negatively. On average the stocks selected in this pan-European universe saw a closing price deviation of 1%. That means for the €33bn traded in the closing auction that day, there was a total cost or profit of €300mn depending on whether you were on the right or wrong side of the decision to trade in the auction.
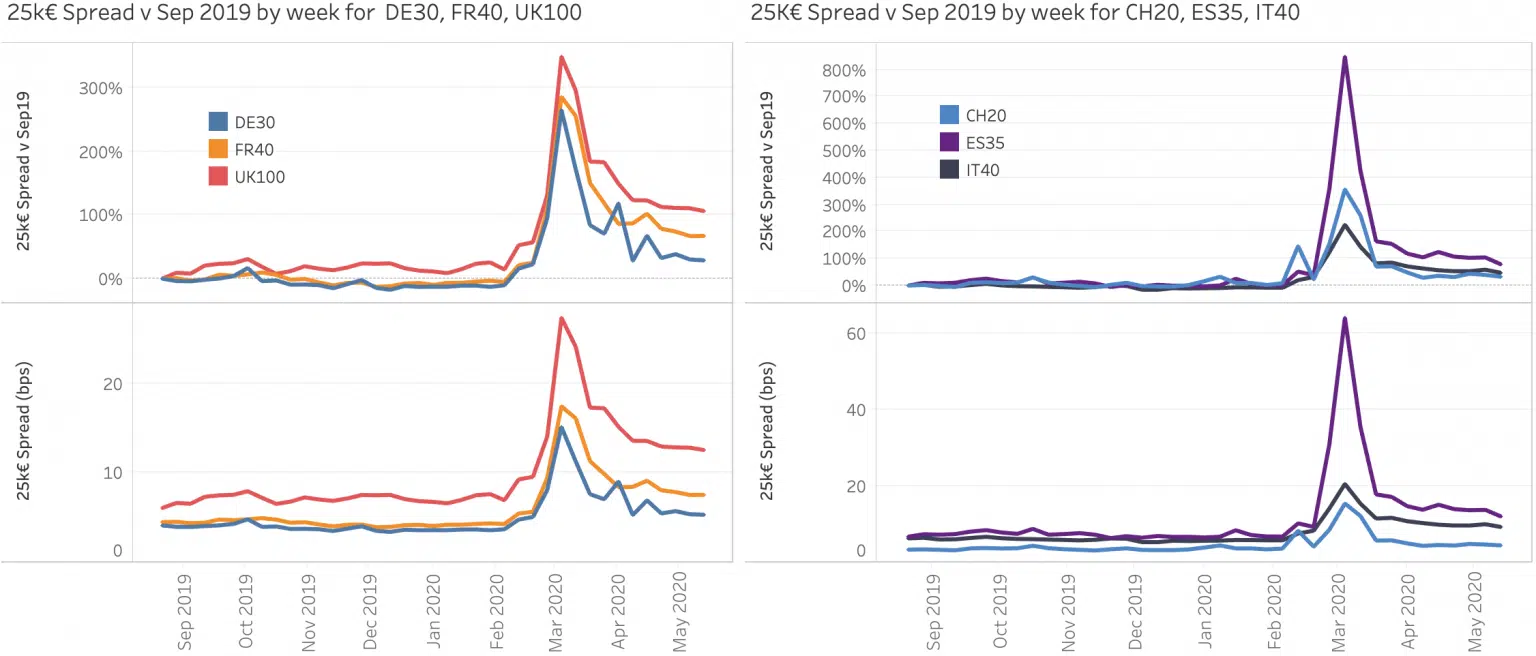
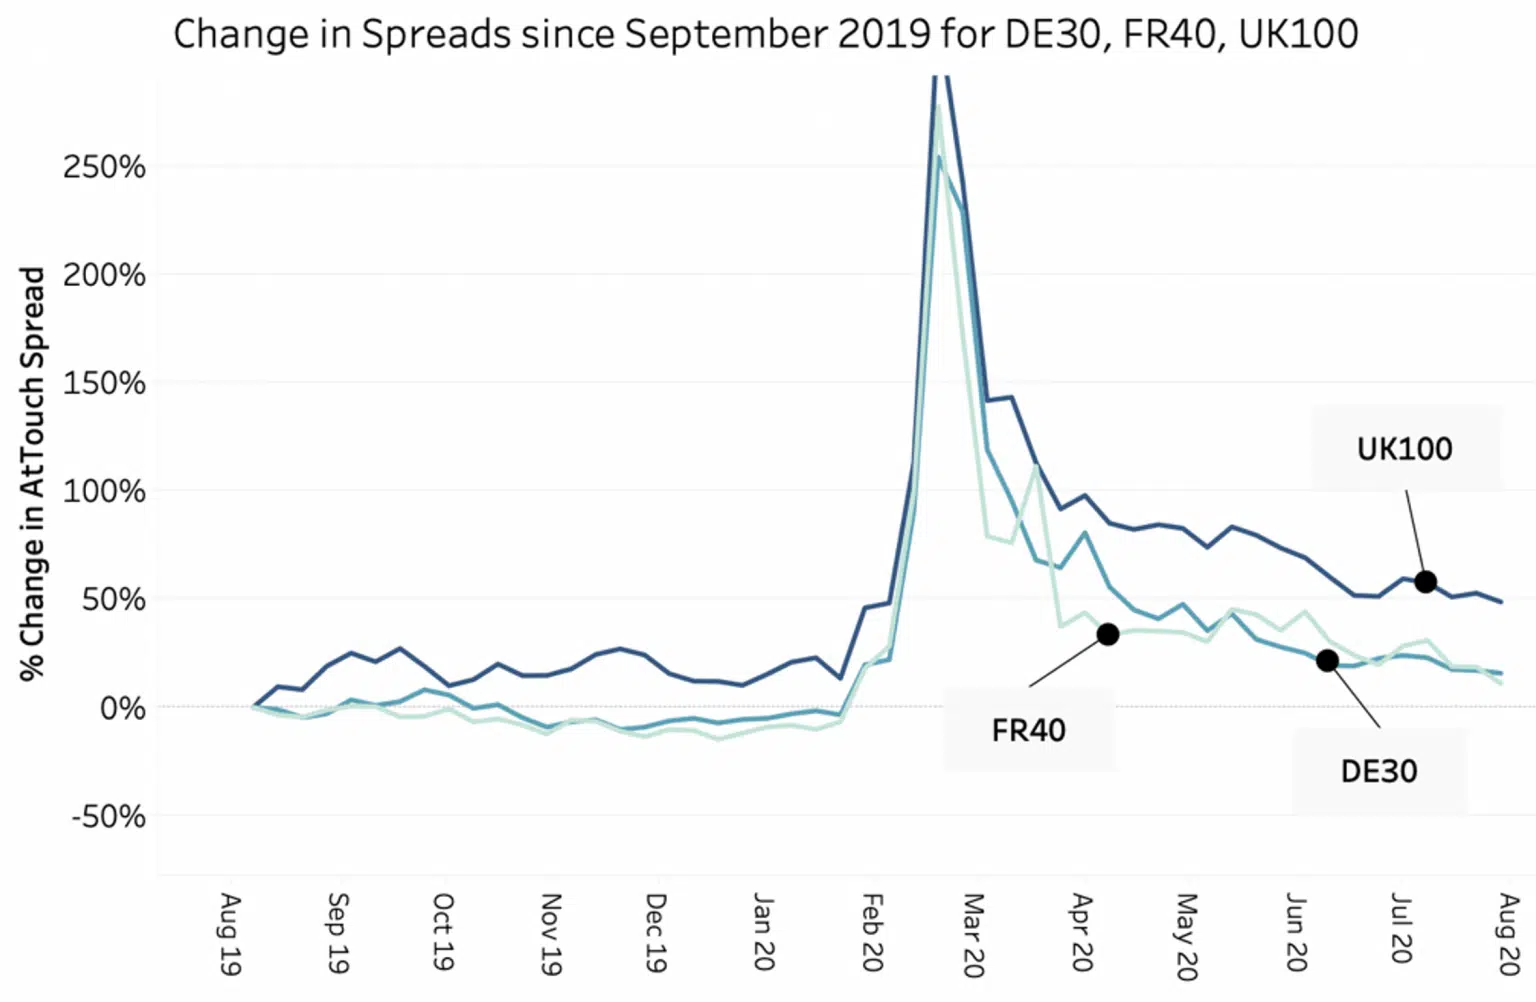
May could almost be described as uneventful in that volumes and market share seem to have reverted to business as usual. A quick look at some market quality metrics tells us that this is far from the case as uncertainty and volatility continue. The chart shows the weekly evolution of spreads since September 2019, both in absolute terms (in bps) and the %change since September for each index. For the most liquid, large cap names in Europe, spreads remain well above their pre crisis levels notably for the UK100.
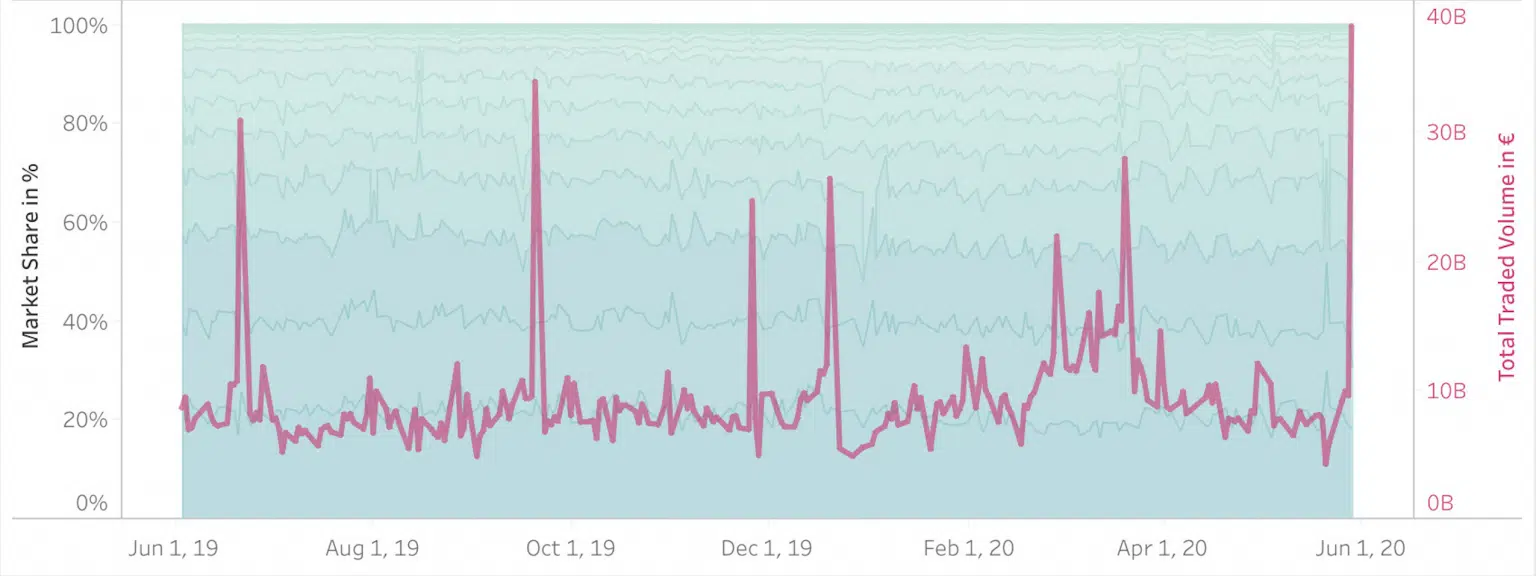
Turnover of equities including ETFs in closing auctions reached record levels on Friday. The volumes were higher than any other day during the past 12 months (including all expiry dates and rebalancing dates). 40B€ total closing notional (incl. ETFs) was reported including approximately 35B€ cumulatively in the regional indices. The increased closing activity coinciding with the MSCI rebalance also exceeded the most volatile days in Q1 precipitated by the Covid crisis. The attached screenshot was created with the Liquidity Cockpit main Traded Volumes Market Share Analysis view & selecting Closing Auctions only.
The Liquidity Cockpit has evolved thanks to continuous feedback from our clients and we are delighted to be adding to the content with a brand new Enterprise section to the menu. Our Enterprise Plan allows for unlimited dashboards. Furthermore this plan gives access to the full flexibility of the API with our technical support for its use and for integration with visualisation tools. As an example, these can be used to create custom views & dashboards for your regular or bespoke use.