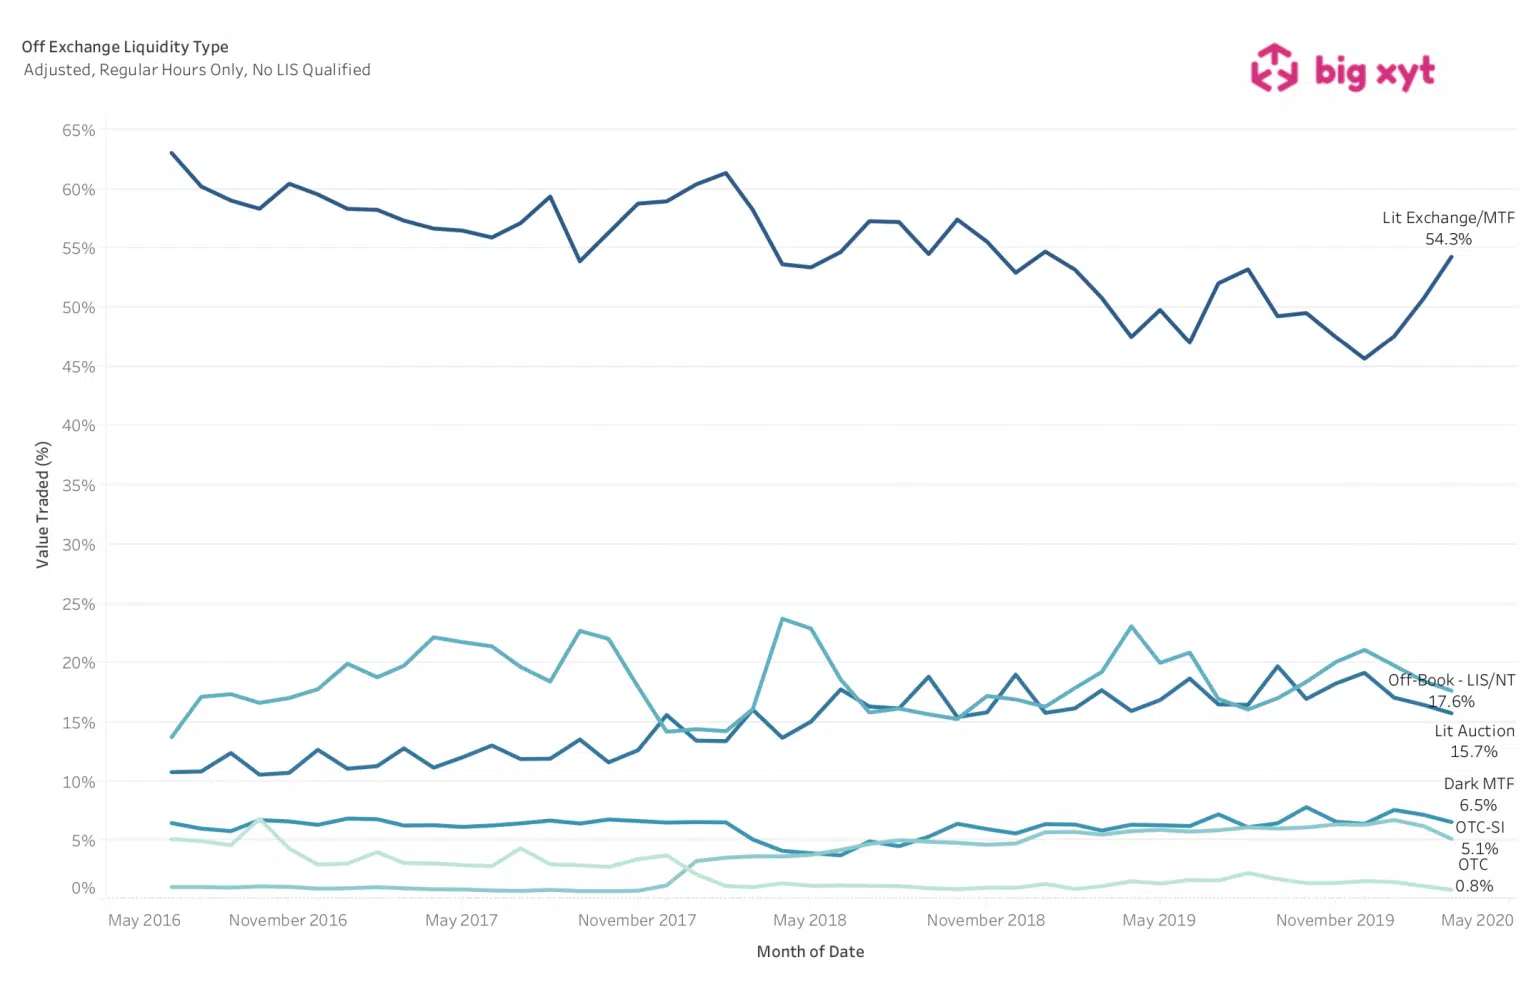
Following our first post in this series, a number of people have asked if the trend we observed has continued over subsequent days. The ingredients are consistent – uncertainty, volatile markets, and unpredictable liquidity leading to opportunity cost with other less immediate execution pathways. It is no real surprise to see lit markets continue to maintain market share at the expense of all other mechanisms. At big-xyt we can provide daily volume curves for users and algo developers in 12,000 instruments and all significant venues, as well as many other essential trading metrics. If you are interested in letting us do some of the heavy lifting for your algo infrastructure please get in touch.
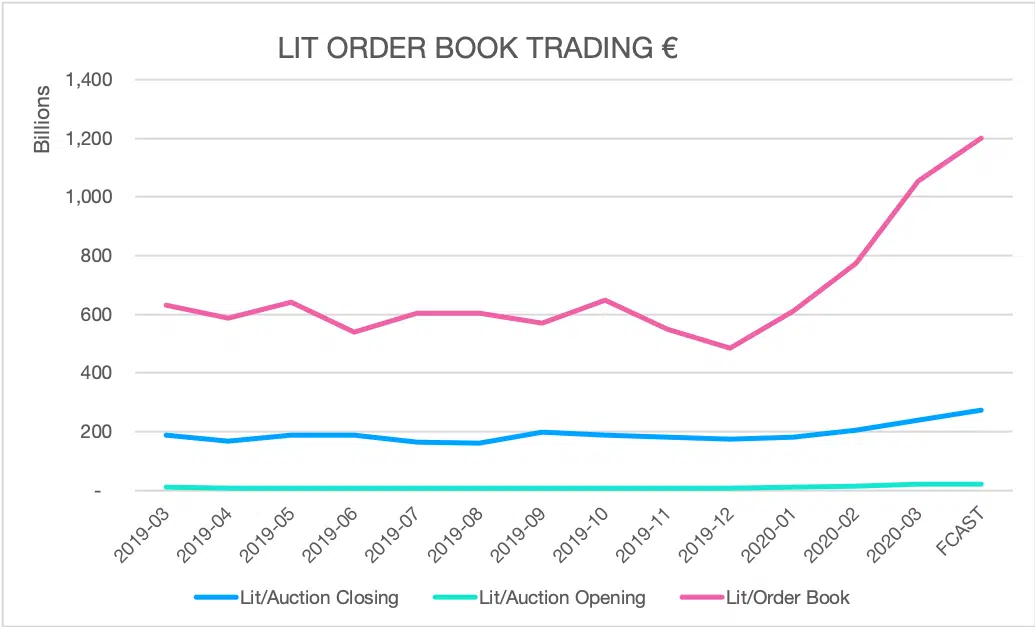
It is not news to anyone that trading volumes have simply exploded this month to record levels. We put some eye watering facts and figures on this in a historical context and look at one surprising finding; the distribution of volumes throughout the trading day has hardly changed at all. Do we detect the cool hand of trading algorithms behind this remarkable observation ? We ask some questions as to why this might be, and reflect on how far we have come with electronic trading. Article We mentioned earlier in the week that volume was returning to the lit order books from other types of trading venue – such as the end of day auctions. Just taking trades executed electronically on lit markets, we find that volumes increased from an
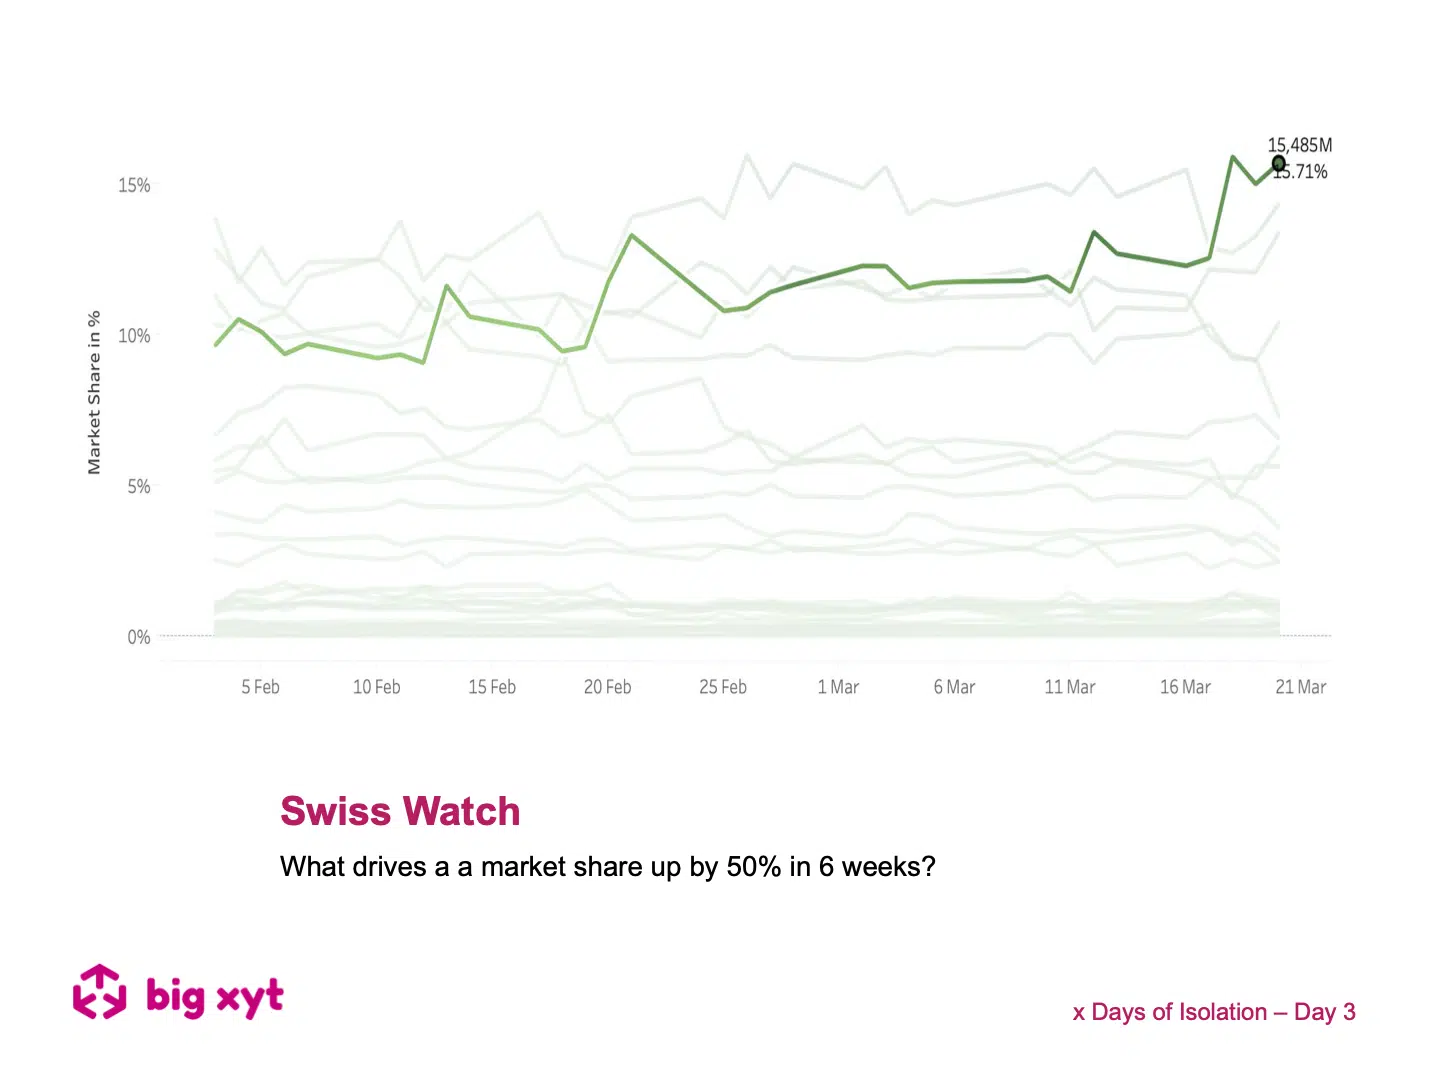
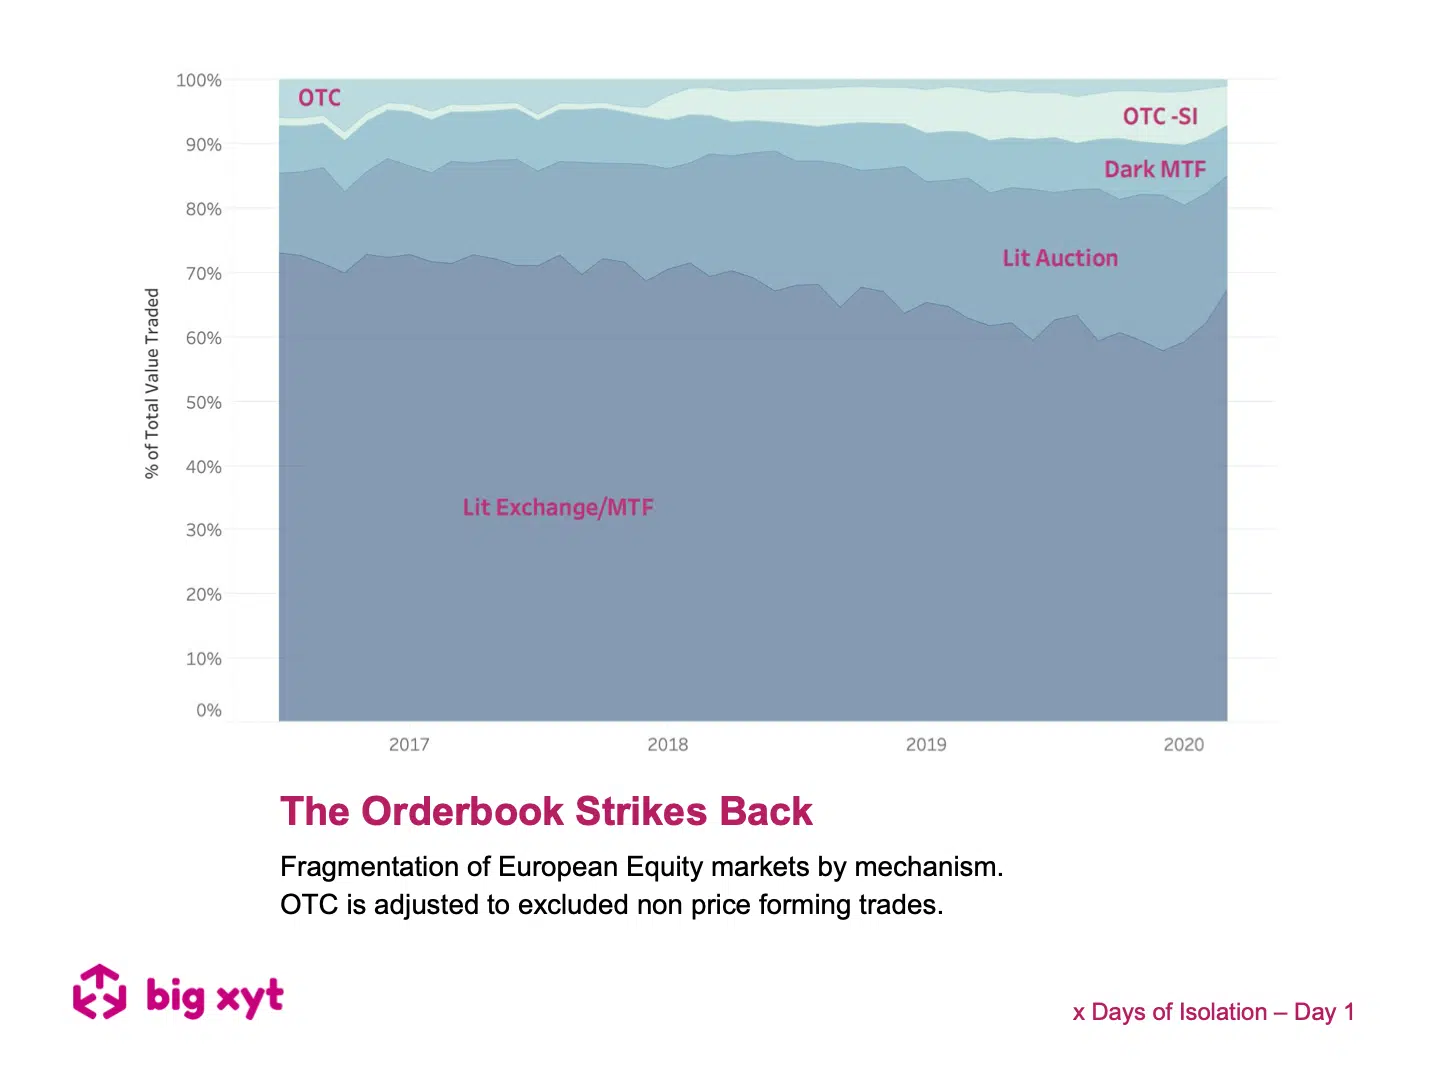
The chart today shows the changing market share of European Equity trading venues during 2020.The highlighted line is the focus of the following observations. Last Summer when Swiss non equivalence was announced, overnight competition from MTFs was outlawed and the SIX Swiss exchange saw a 25% increase in share from 8% to 10% of European equity turnover. Without any legislative announcements, something even more dramatic has transpired since the beginning of February. The same venue has just grown its share by a further 50%. At the beginning of February the Swiss market was the fourth largest European venue by turnover with just under 10% market share.
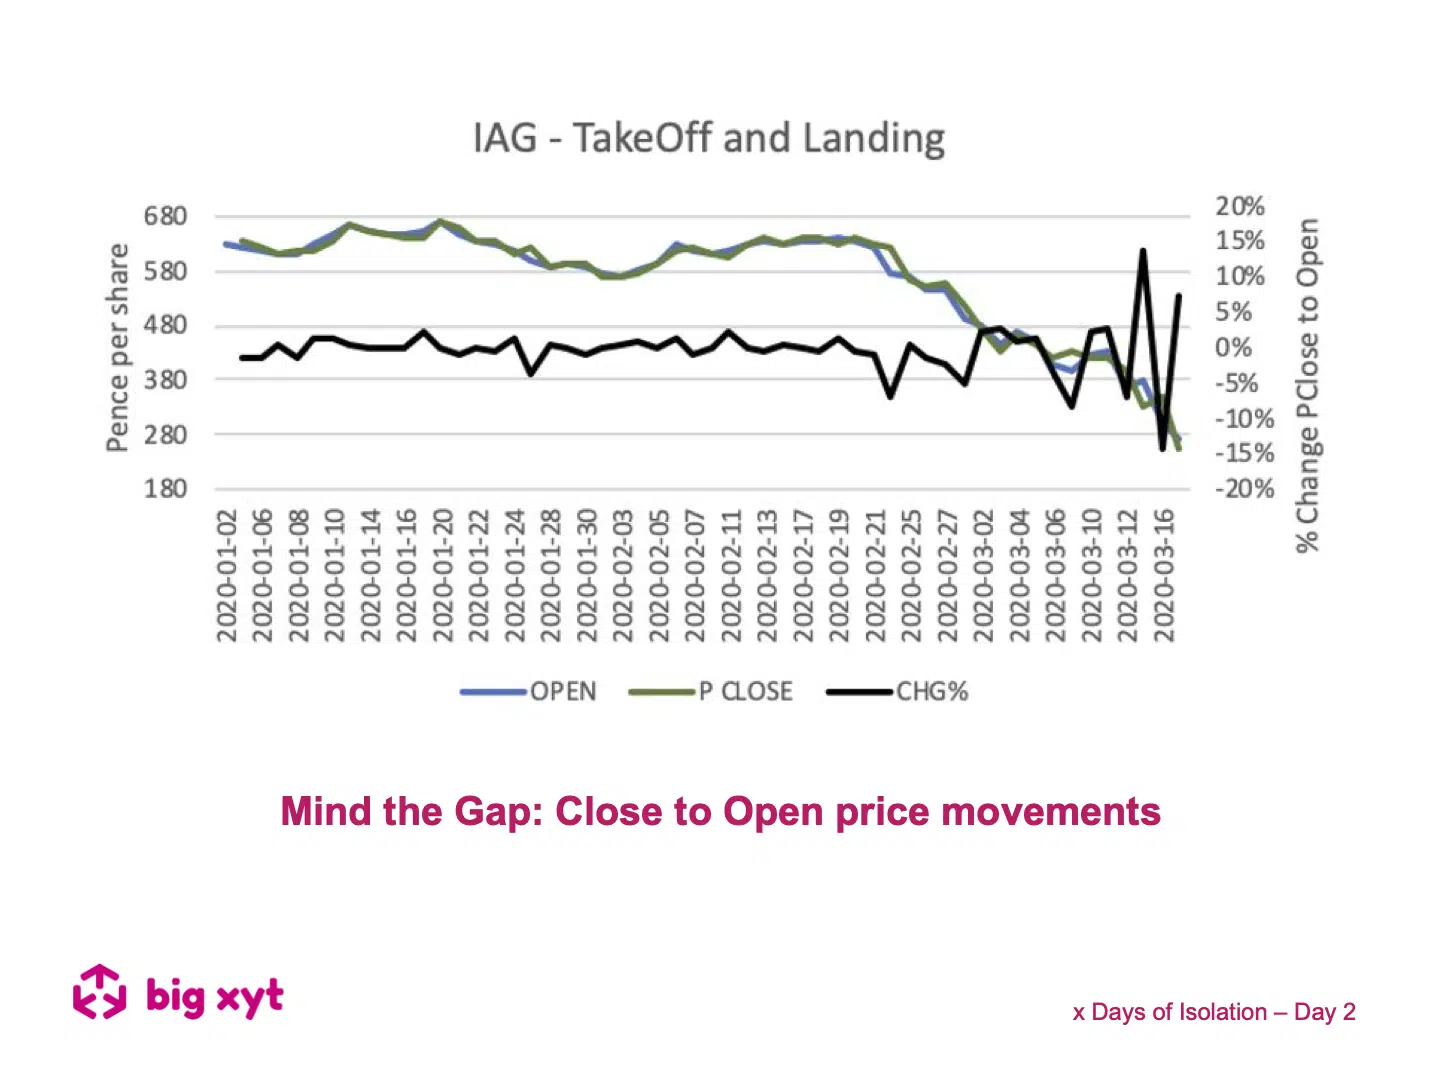
In this article, we look at the difference in price between two major benchmarks, the Previous Close and the Open – the ‘overnight gap’. The equities market is only open for around 8 hours a day 5 days a week, or just under 24% of the time, leaving 16 hours (more at the weekend) for investors to absorb news from around the world and decide what to do next. The market Open can be thought of as a catch up on price formation. By keeping an eye on the volatility of this gap over time, we get a feel for whether the market is stabilising or destabilising and it can be a useful barometer of whether a consensus is forming. At the moment, there is no sign of that happening.
During these unprecedented times we do not underestimate the professional and personal challenges that everyone is facing. There are far more important things to be doing in the community than looking at a screen. However, data and data analytics is playing a critical part in providing solutions to the current global crisis. Furthermore, the markets remain open and whilst they do, the trading community needs to be well informed in order to understand the changing market landscape. As a result, big xyt is receiving an increasing number of requests for observations of changing trends and behaviours in the equity markets. We are excited to have recently expanded our London team to enrich our content and support for clients seeking greater market insights from an independent source. Whilst many adjust to the new experience of working from home we plan to share some of these thoughts, observations and questions in the coming days & weeks.
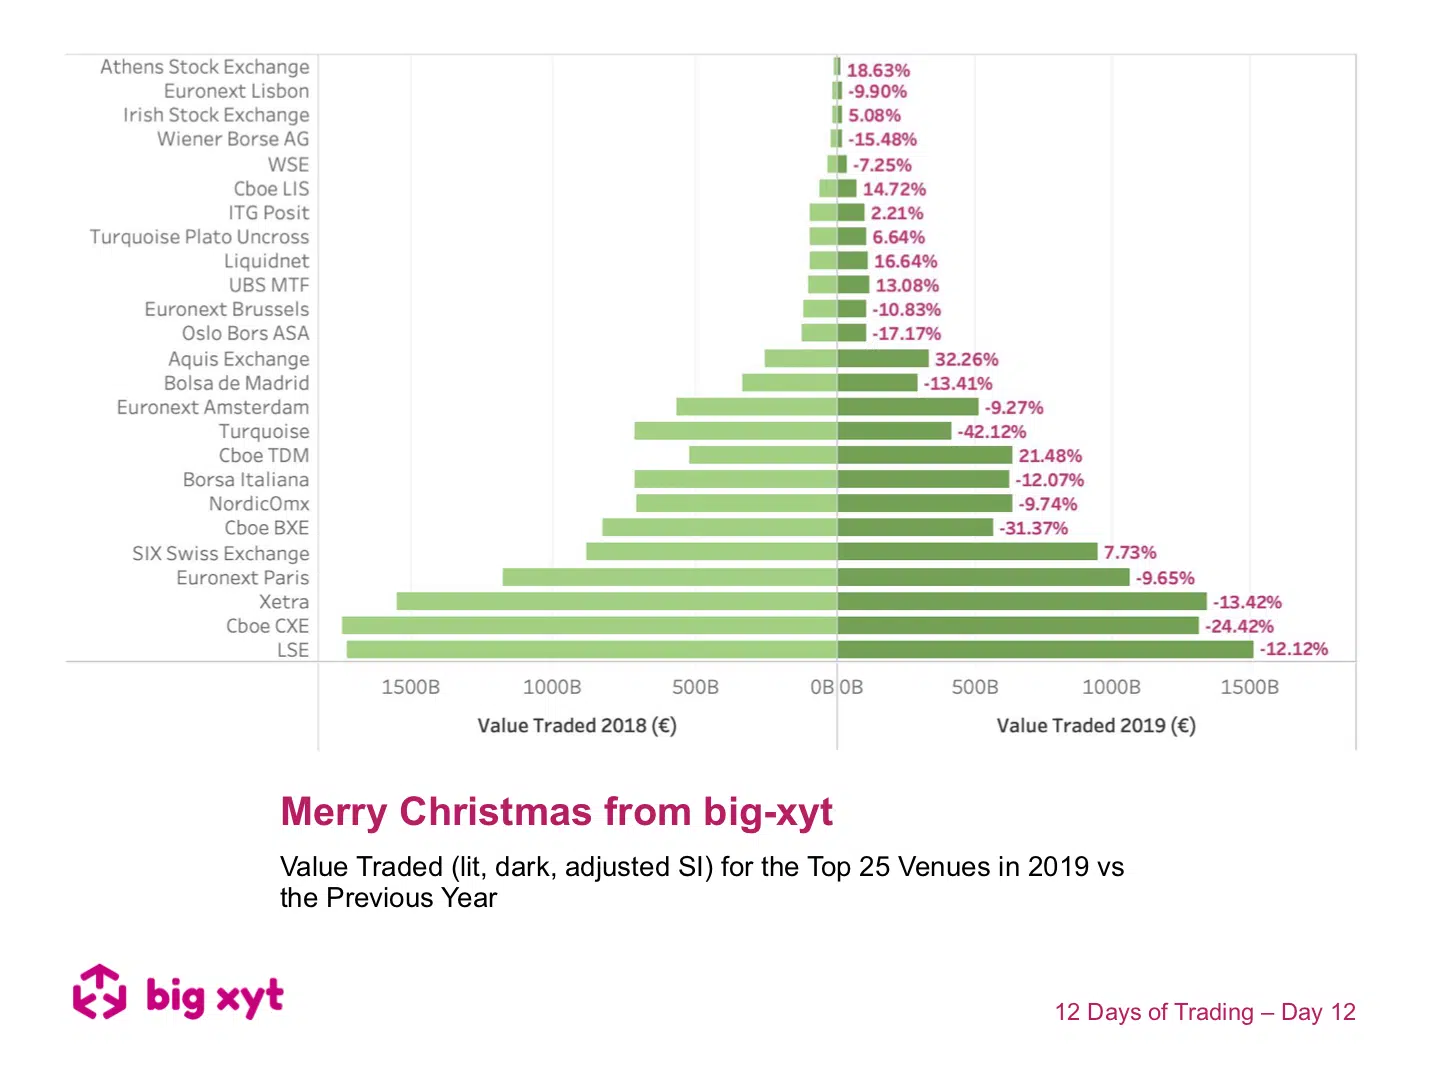
Well, it’s Christmas Eve folks and what better way to see out the old & see in the new year than to reflect on the changes in the last 12 months. We look forward to introducing new content to help provide 2020 vision next year, so watch this space. In the meantime, the chart today, whilst festive in its intent does show some changing trends throughout the year. As a backdrop to these changes, overall volumes declined 12% during the period and the Swiss non-equivalence influenced that particular market from July. If you have found these pieces of analysis useful, you will find there is a lot more you can do with our Liquidity Cockpit. Clients using our Execution Analysis/TCA are able to measure execution performance with the demonstrated precision and flexibility
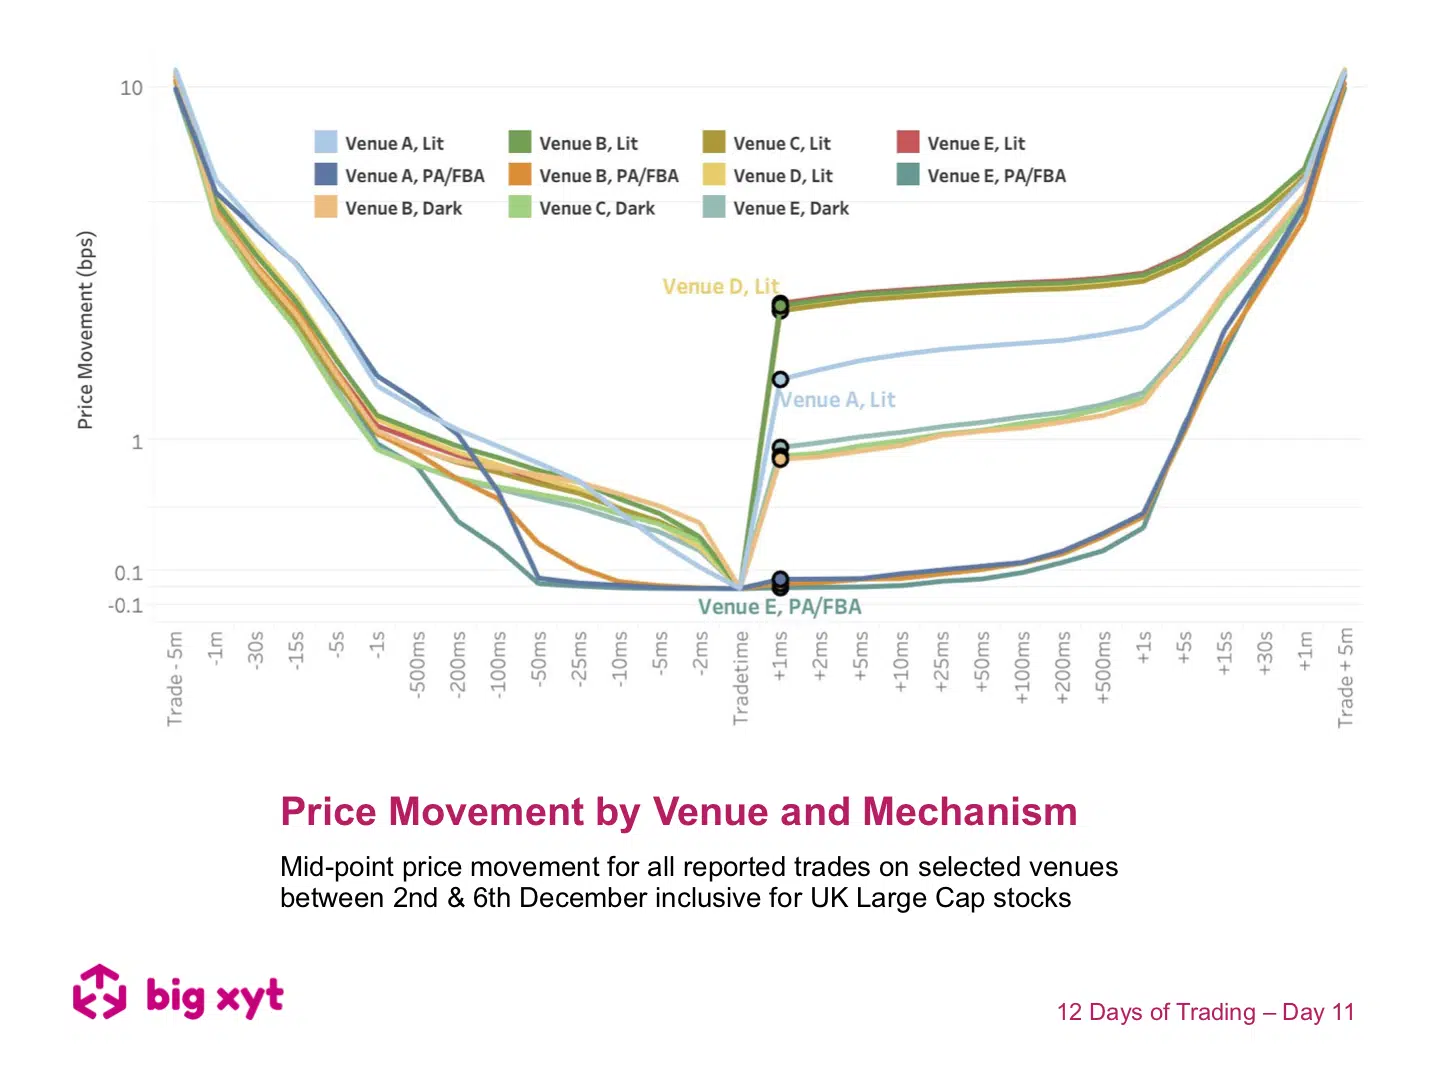
The chart today returns to a theme we have covered before but with additional layers uncovered. In the past, we have viewed the movement of the mid point before and after every trade to build up a pattern for each trading mechanism. We have developed this further so that each venue can be singled out whether lit, dark or periodic auction. We have anonymised the venues and excluded blocks and a generic view of Systematic Internalisers from this example. Subscribers to our Liquidity Cockpit API can see this detail in all its glory. Using these new metrics and categorisations is creating new thinking in execution analysis. In addition to comparisons with recognised benchmarks, traders can now see how they compare to a typical profile when they or their brokers route to different venues and market mechanisms.
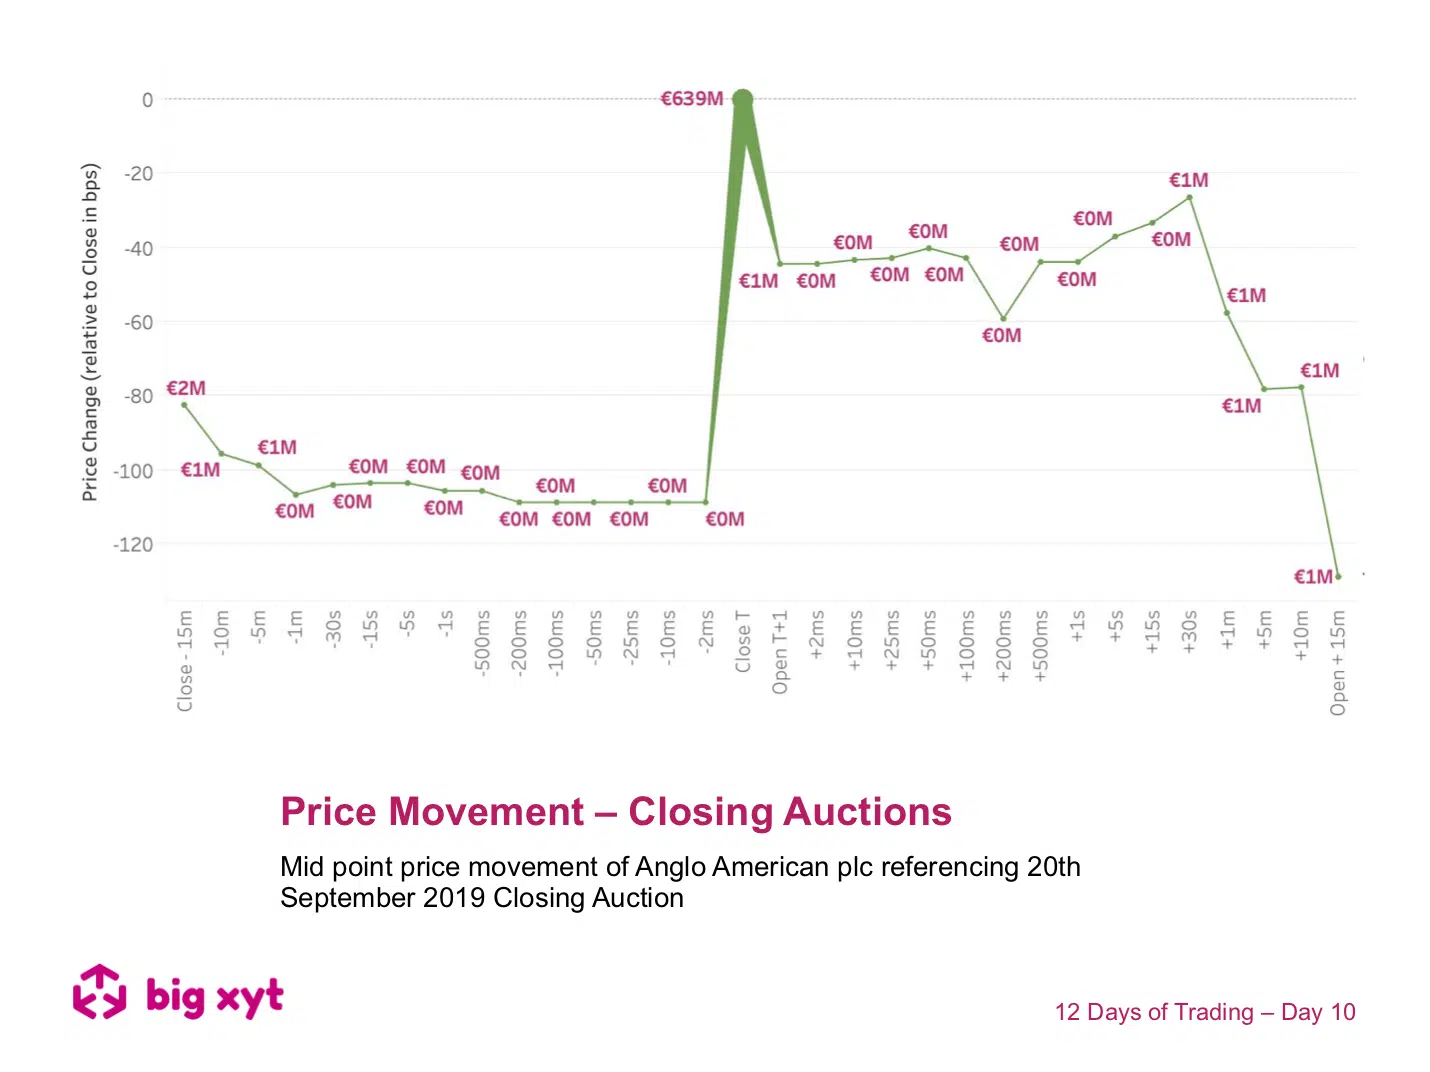
Following previous observations of the growing significance of the closing auction we felt curious as to whether a benchmark price should be the best driver of liquidity. As we saw yesterday, investors were quick to embrace the opening auction and trade more throughout the day when trader/fund manager conviction is higher such as last Friday 13th. So what happens on days when closing volumes are greater, such as index rebalance and derivative expiry days? As you may have seen, we have examined intraday price movement in the past to compare market mechanisms. Today we are introducing a view of movement around the closing price.
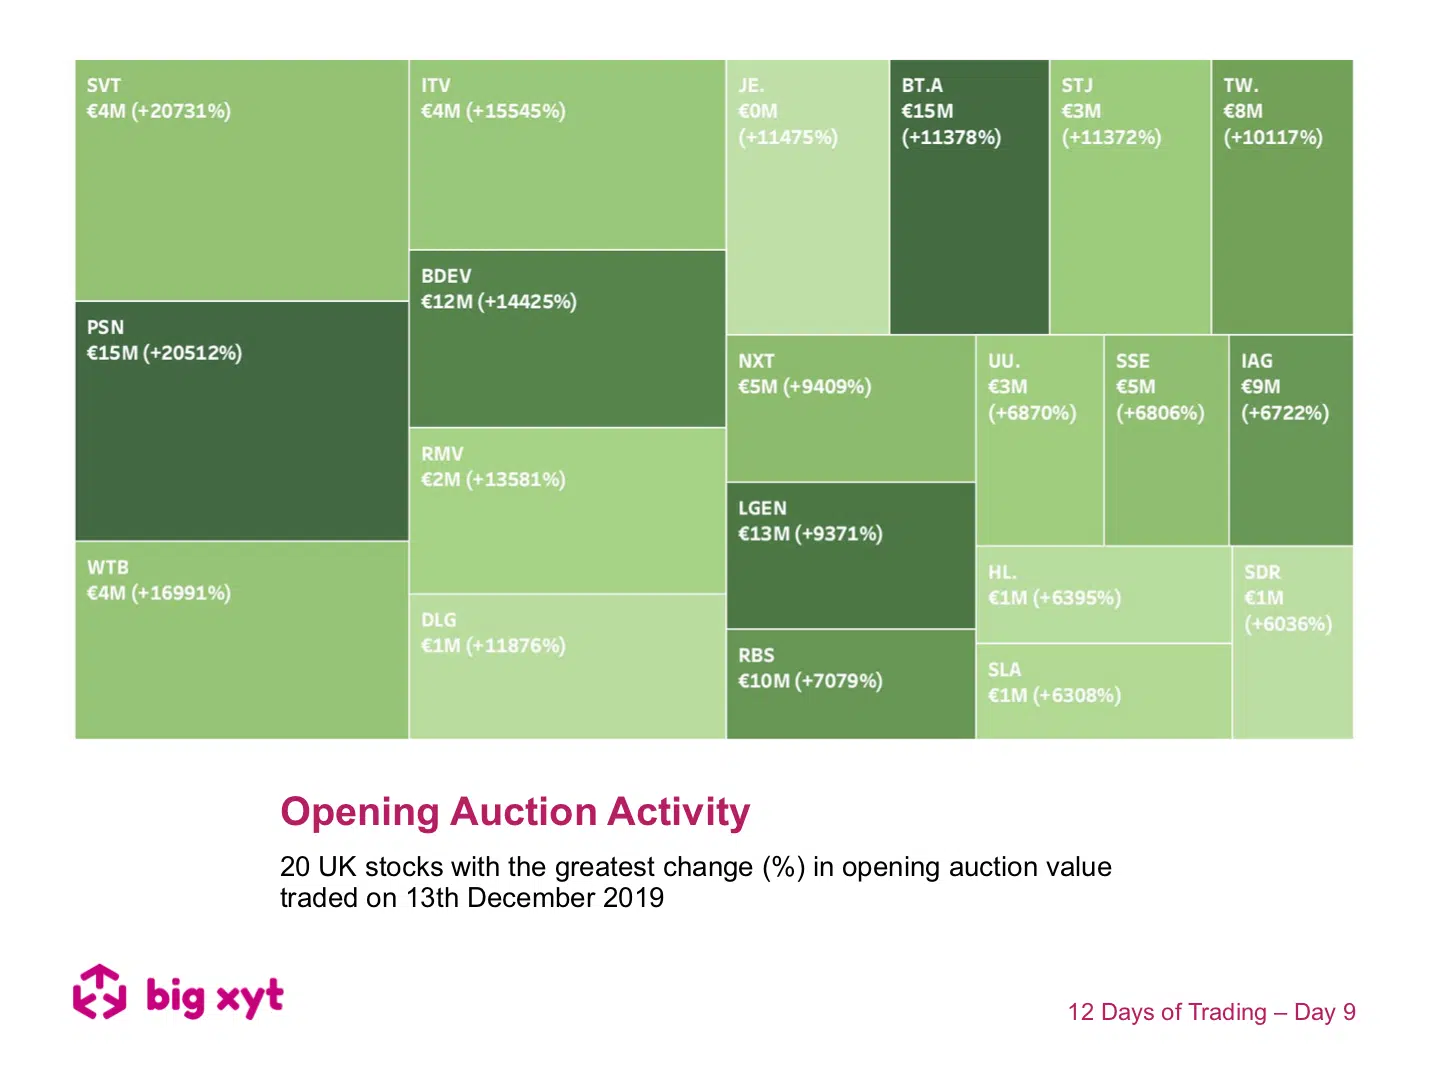
On the morning after the General Election, the chart shows the 20 stocks with the greatest percentage change in opening auction turnover. This could be taken as a proxy for company sensitivity to the political implications as investors acted with both speed and size. This sample is limited for ease of view and the full universe can be viewed and normalised by block size, for example, or absolute value traded. Let us know if you would like to see similar results for block trades during the rest of the same day as investors scrambled to adjust their exposure. Liquidity Cockpit users are able to look at any stock this way and see the venues broken down. Clients using our
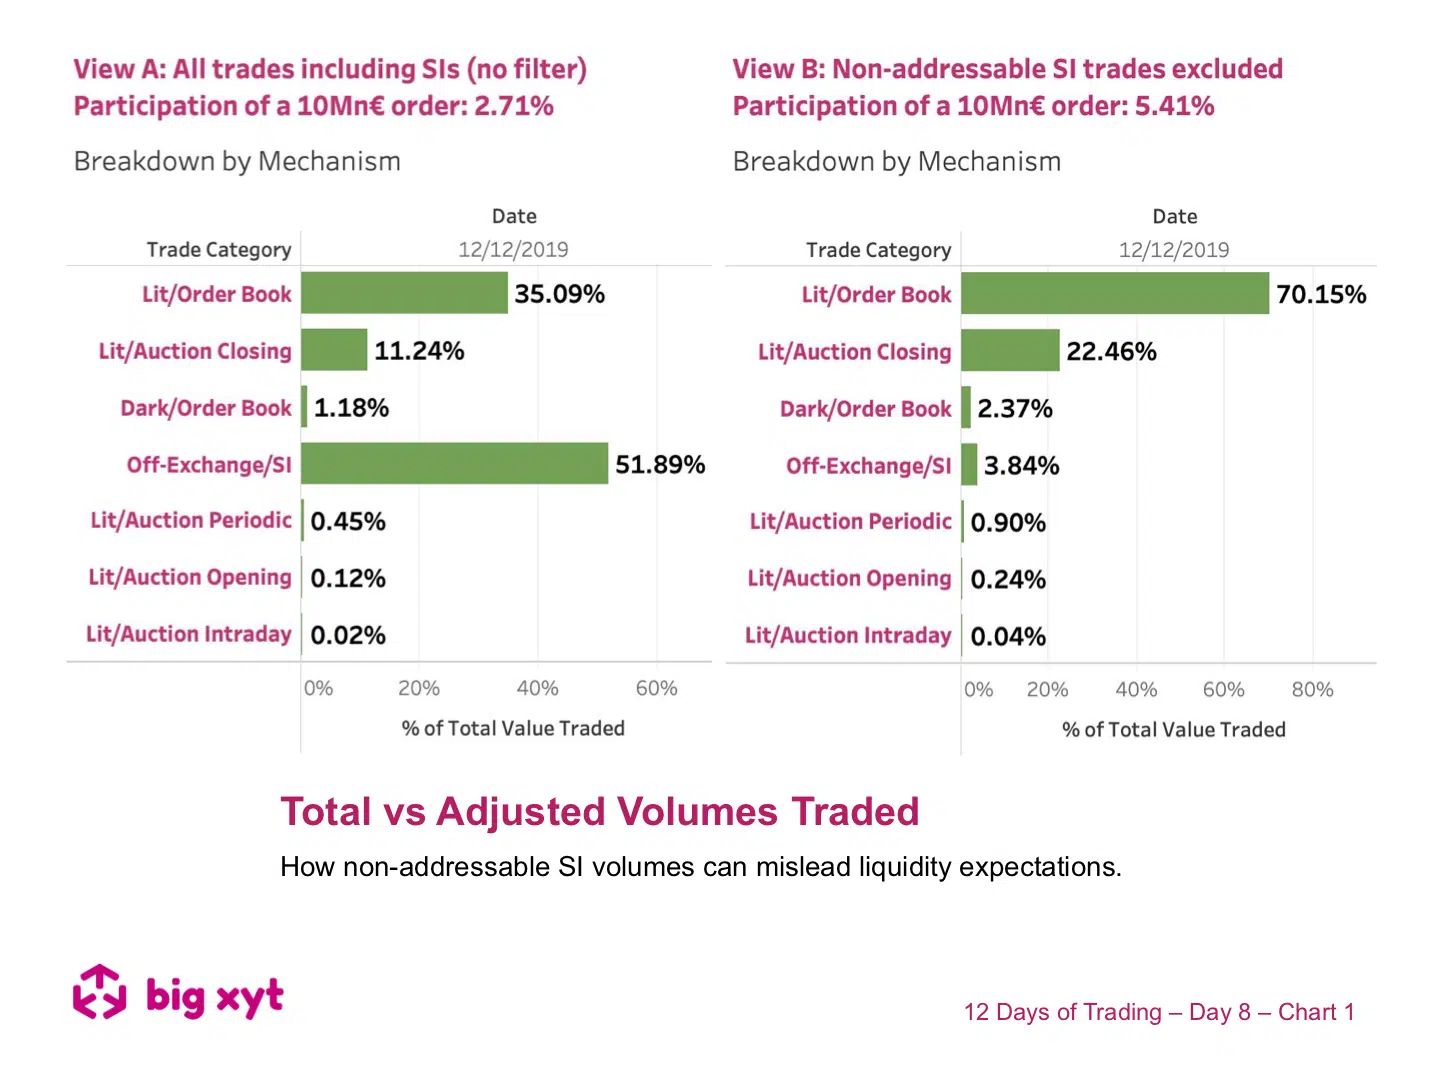
Understanding where the expected liquidity is available is key to any participation strategy. However, if your assumptions relating to expected liquidity include all reported trades, you could find yourself starting from the wrong place. This example looks at Munich Re shares traded on the 12th December (a relatively “normal” day before the UK General Election results were announced). A typical institutional sized order of €10Mn would need to be careful not to impact the market. In view A, on the left, the order represents 2.71% of the days total reported turnover in the stock. But how much of the Systematic Internaliser (SI) volume is unaddressable and gives an over optimistic picture of available liquidity?