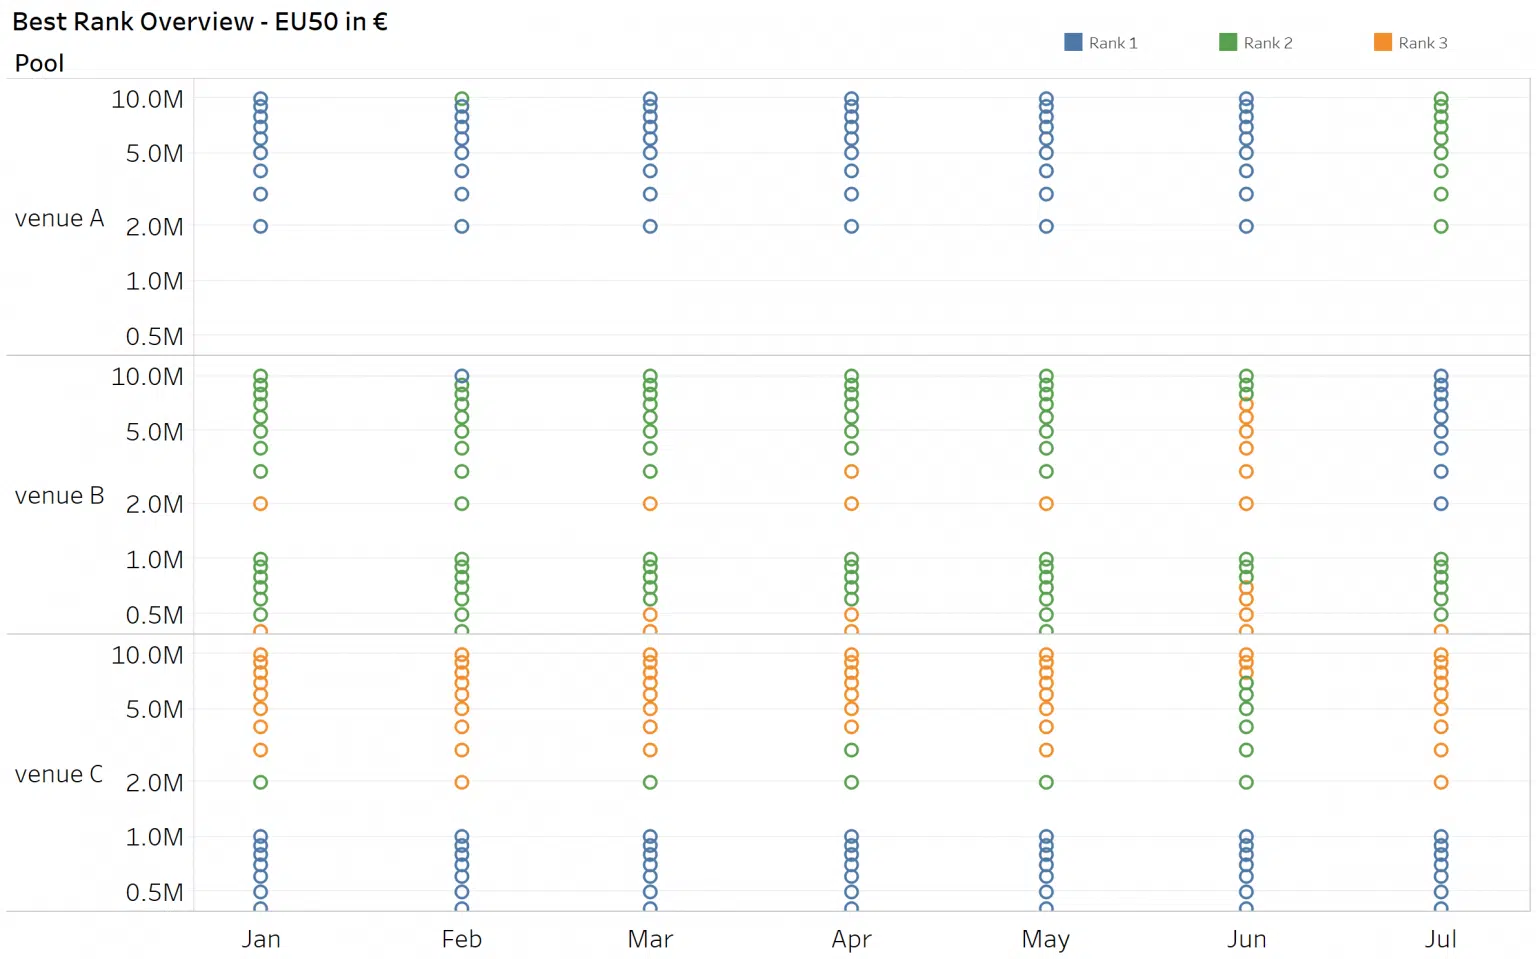
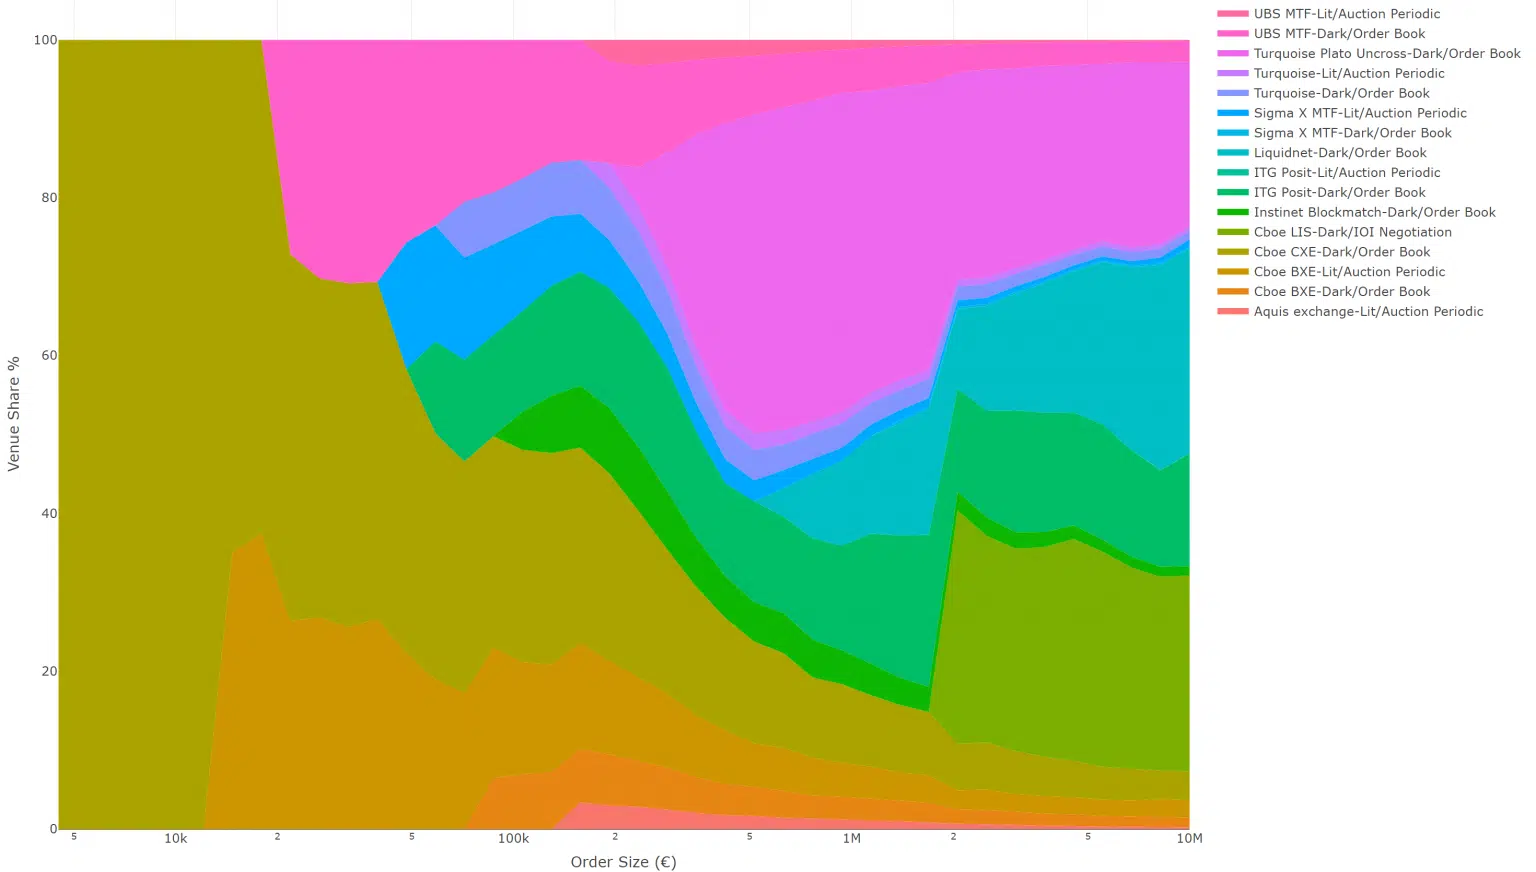
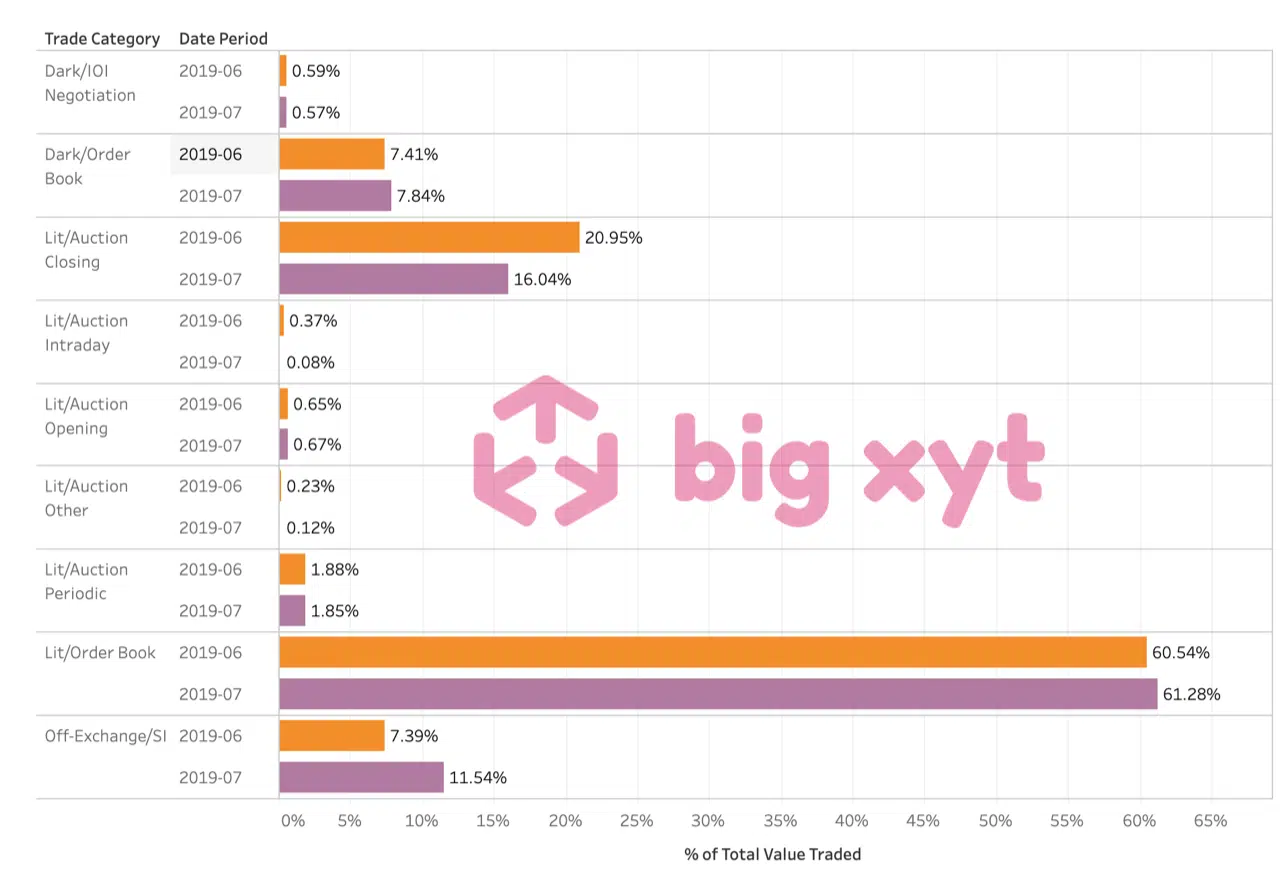
Having a good understanding of how to select a venue when executing a large trade is essential for successful performance. There are many venues to consider and each venue has its own “sweet spot”, depending on the names and size traded and that varies according to your level of urgency. Using objective criteria, such as expected time to execution and likely price impact, we can rank venues into an order of priority for routing. Furthermore, when we look at how this changes over time, we get a sense of the importance of regular monitoring and updating of the smart order routing process.
We know that trading behaviour, microstructure and liquidity all vary significantly between venues and across individual stocks. Understanding these differences has become a very important prerequisite to any market participant. Armed with this knowledge, traders can substantially reduce their execution costs, product managers can design better strategies and trading venues can improve their liquidity sourcing. Traders and practitioners are always faced with the question of which venues to pick and how to rank them. The answer to that question is a little more complex than initially thought and the best short answer one can give is: well, it depends. We know that each venue has three important factors that influence the ranking: the speed of execution (or the number of trades per day); the distribution of order sizes and price improvement which measures the implicit costs of trading in the venue. These are all objective measures that can be approximated from public data.
big xyt shares independent insights on European trading derived from a consolidated view on cash equity markets. The measures covered below are used as a reference by exchanges, brokers and buyside firms, reflecting answers to relevant questions occuring in the post-MiFID II era. The methodology is fully transparent and applied to tick data captured from all major venues and APAs (Approved Publication Arrangements). During the first half of 2018, market participants and observers are continuing to evaluate the changing liquidity landscape of European equities. One of the key questions this year is around the introduction of a ban on Broker Crossing Networks (BCNs), thereby outlawing the matching of a bank or broker’s internal client orders without pre-trade transparency for the rest of the market. Would this ban effectively force BCN activity onto the lit markets (public exchanges), as intended by the regulator with its desire to maximise the transparency of all orders, both pre- and post-trade,
Over the past five years, the pace of change in the European equities and ETF markets has been almost unparalleled. This in turn is fuelling demand from the buyside community for greater transparency in the form of data and metrics in order to achieve best execution, optimise their trading activities and ultimately make better informed decisions. Yet obtaining the quality of detailed, reliable and completely independent data required to analyse market structure changes has created its own set of additional challenges, not only for the buy-side and sell-side, but also for exchanges, trading venues and even policy makers and regulatory bodies. For many, the idea of a ‘consolidated tape’ is often the first solution that springs to mind. But would it be the panacea that firms seem to expect?
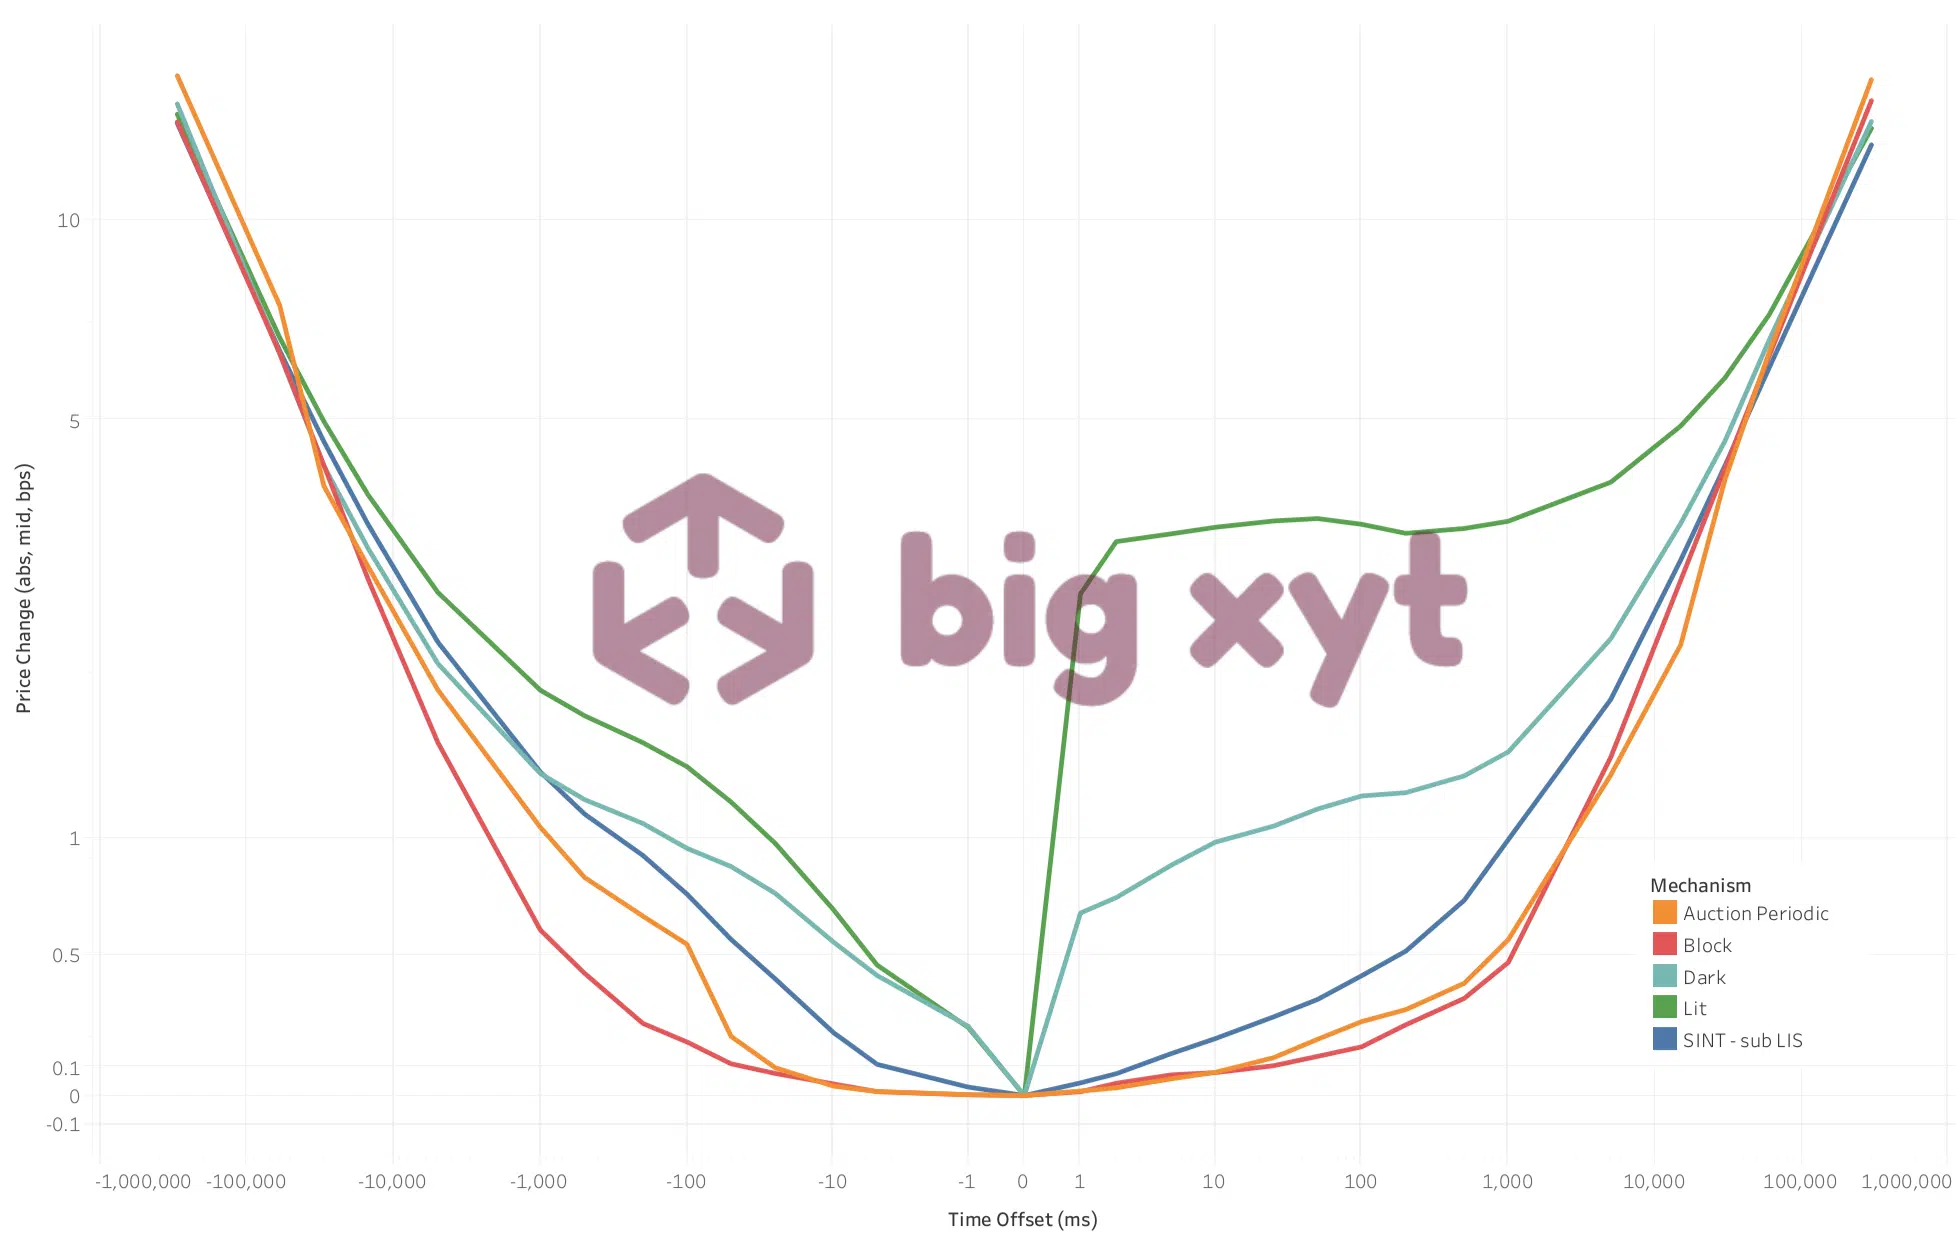
For participants in the European equities markets, the use of smart measures around price movements before and after each trade can help to better inform execution decisions, and therefore optimise and improve execution quality. By capturing every tick in the market for each stock across all venues, we can see how a share price moves before and after each trade. In normal circumstances, most liquid stocks can be expected to trade at least once within a five-minute period, certainly it is likely that a movement will occur in the bid or ask and therefore the midpoint. We can measure either the percentage likelihood of a move within the time period or the magnitude of the price change in basis points at a given interval.
When navigating through the complexities of European equity liquidity, one could be forgiven for wondering whether, for many market participants, the changes in regulation brought about since January 2018 through MiFID II have been a help or a hindrance. MiFID II was designed to introduce more transparency. But have aspects of it made the markets more opaque? One example is around the proliferation of Systematic Internalisers (SIs). Although this category of market participant was actually introduced under MiFID I, it has only really seen greater adoption since MiFID II outlawed Broker Crossing Networks (BCNs) and in so doing blocked the systematic matching of client to client orders. The SI regime created an alternative way for investment banks to match proprietary
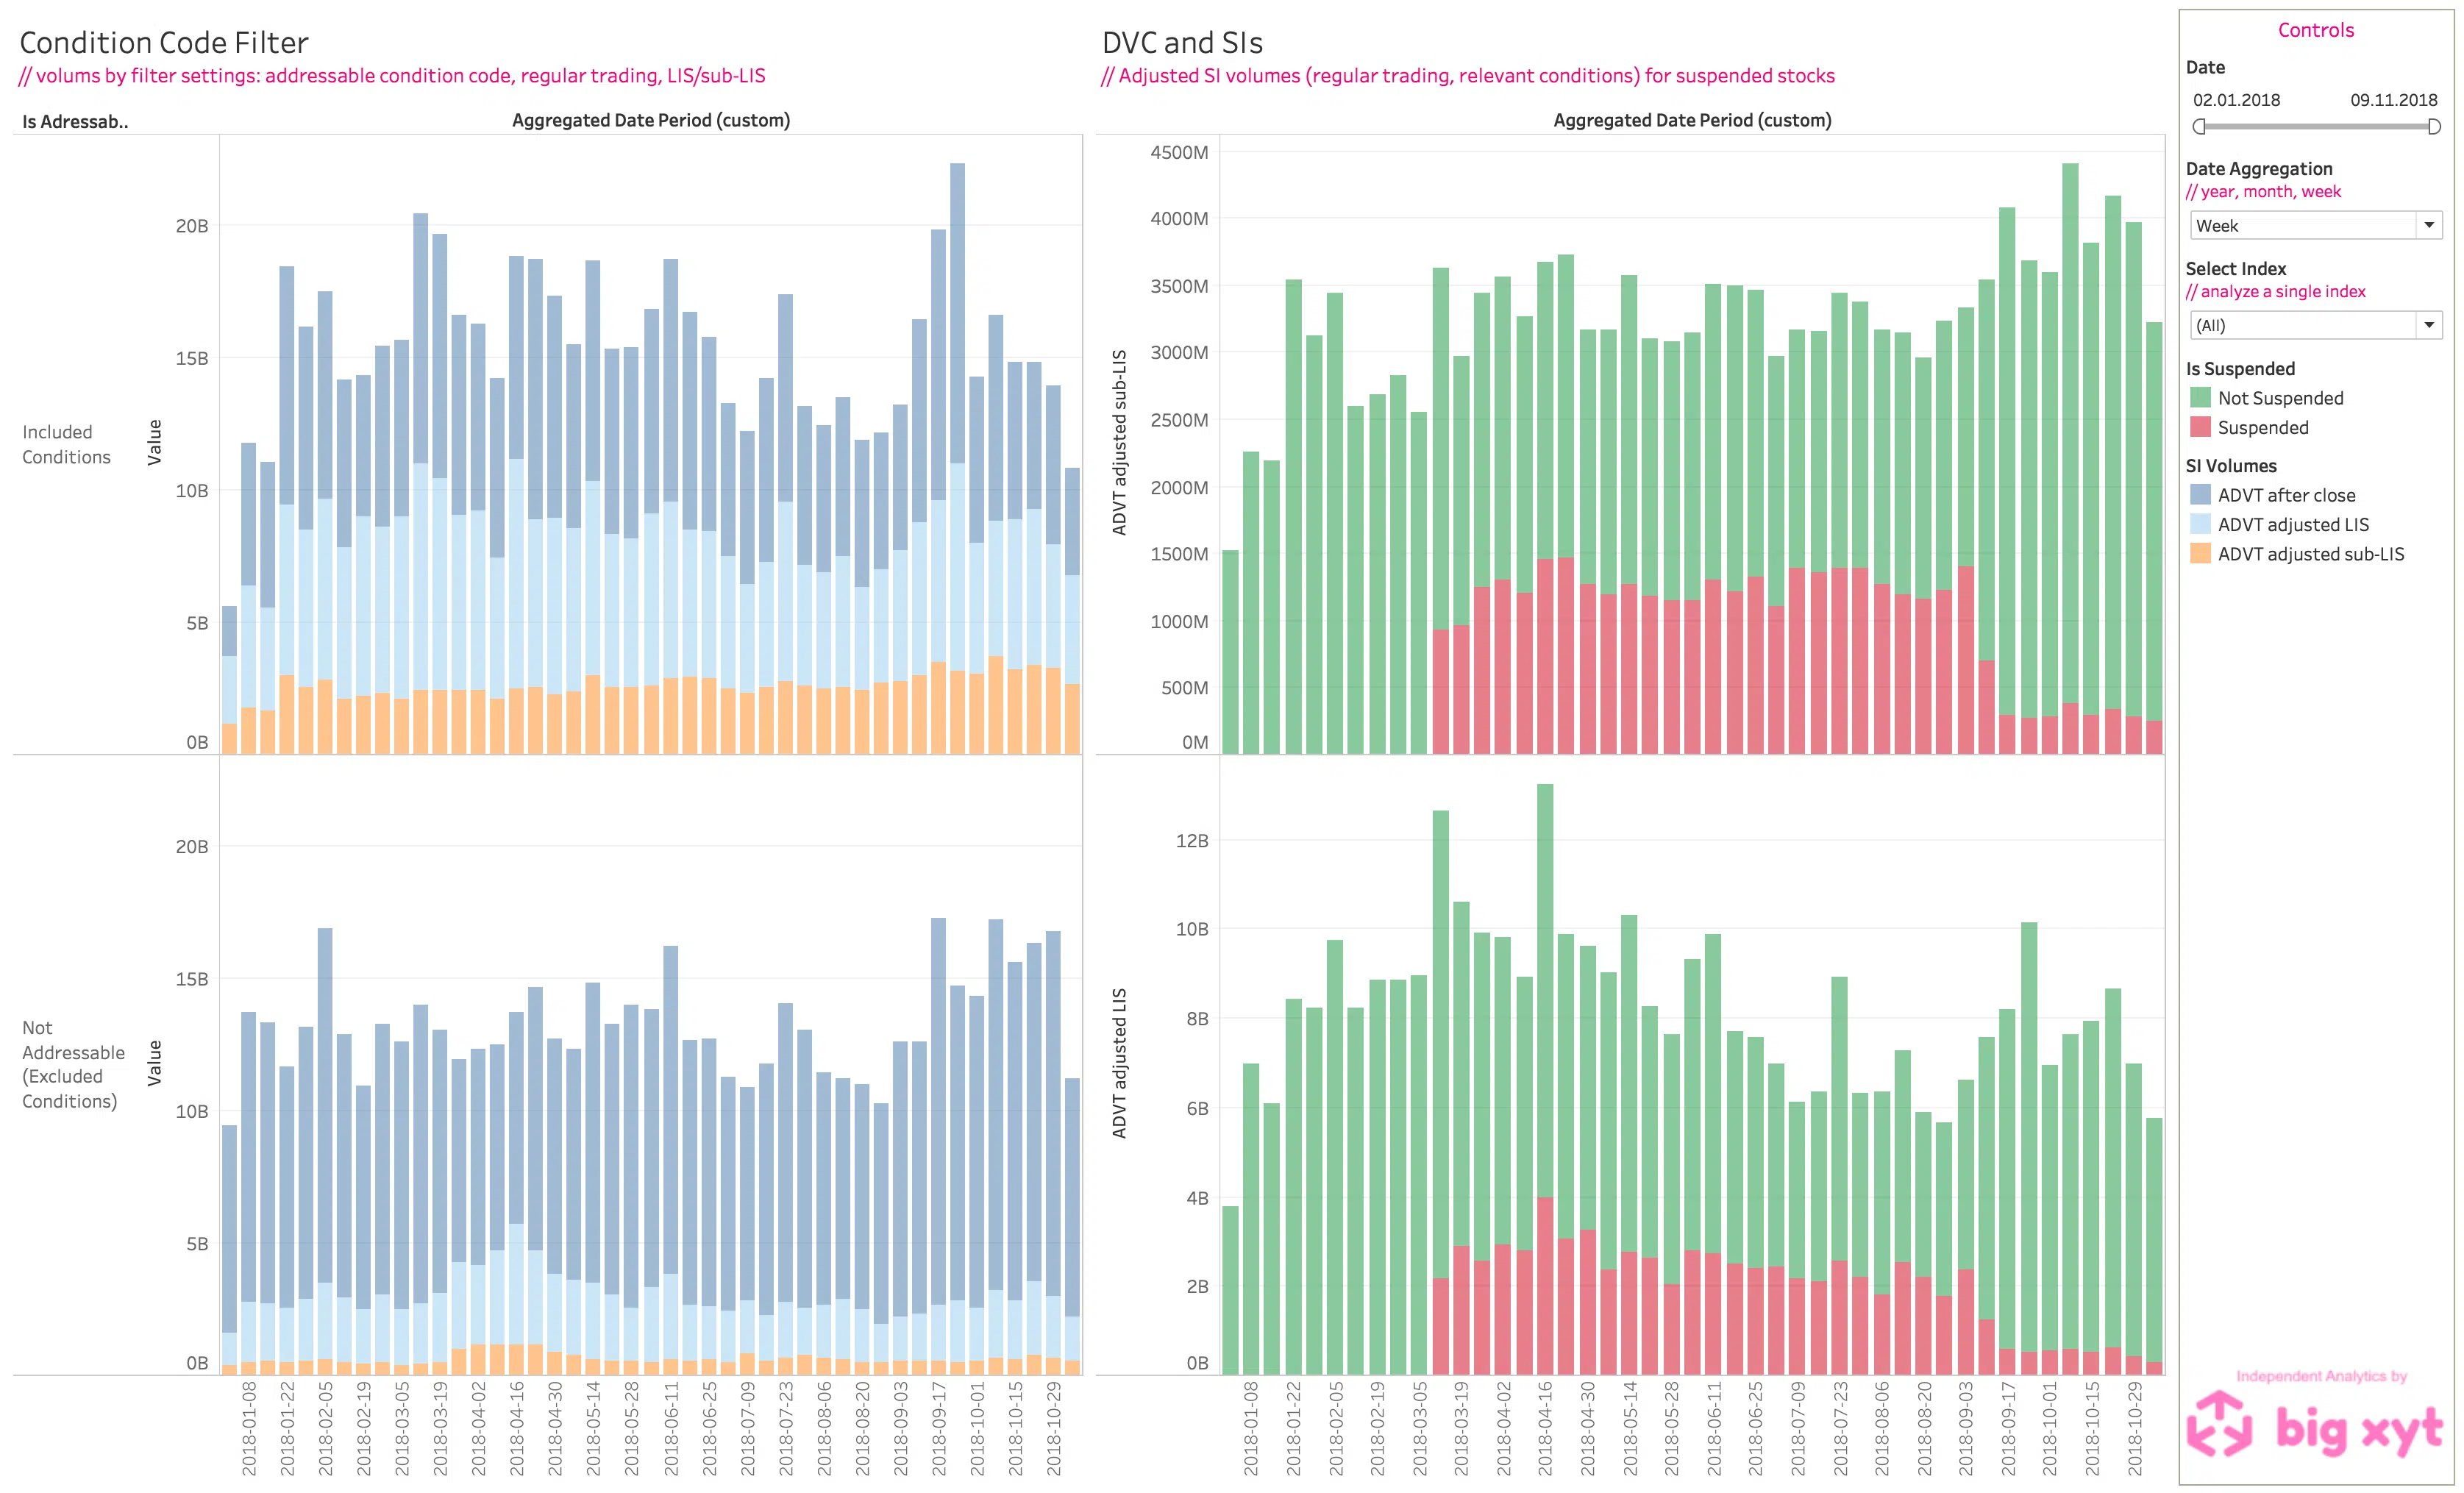
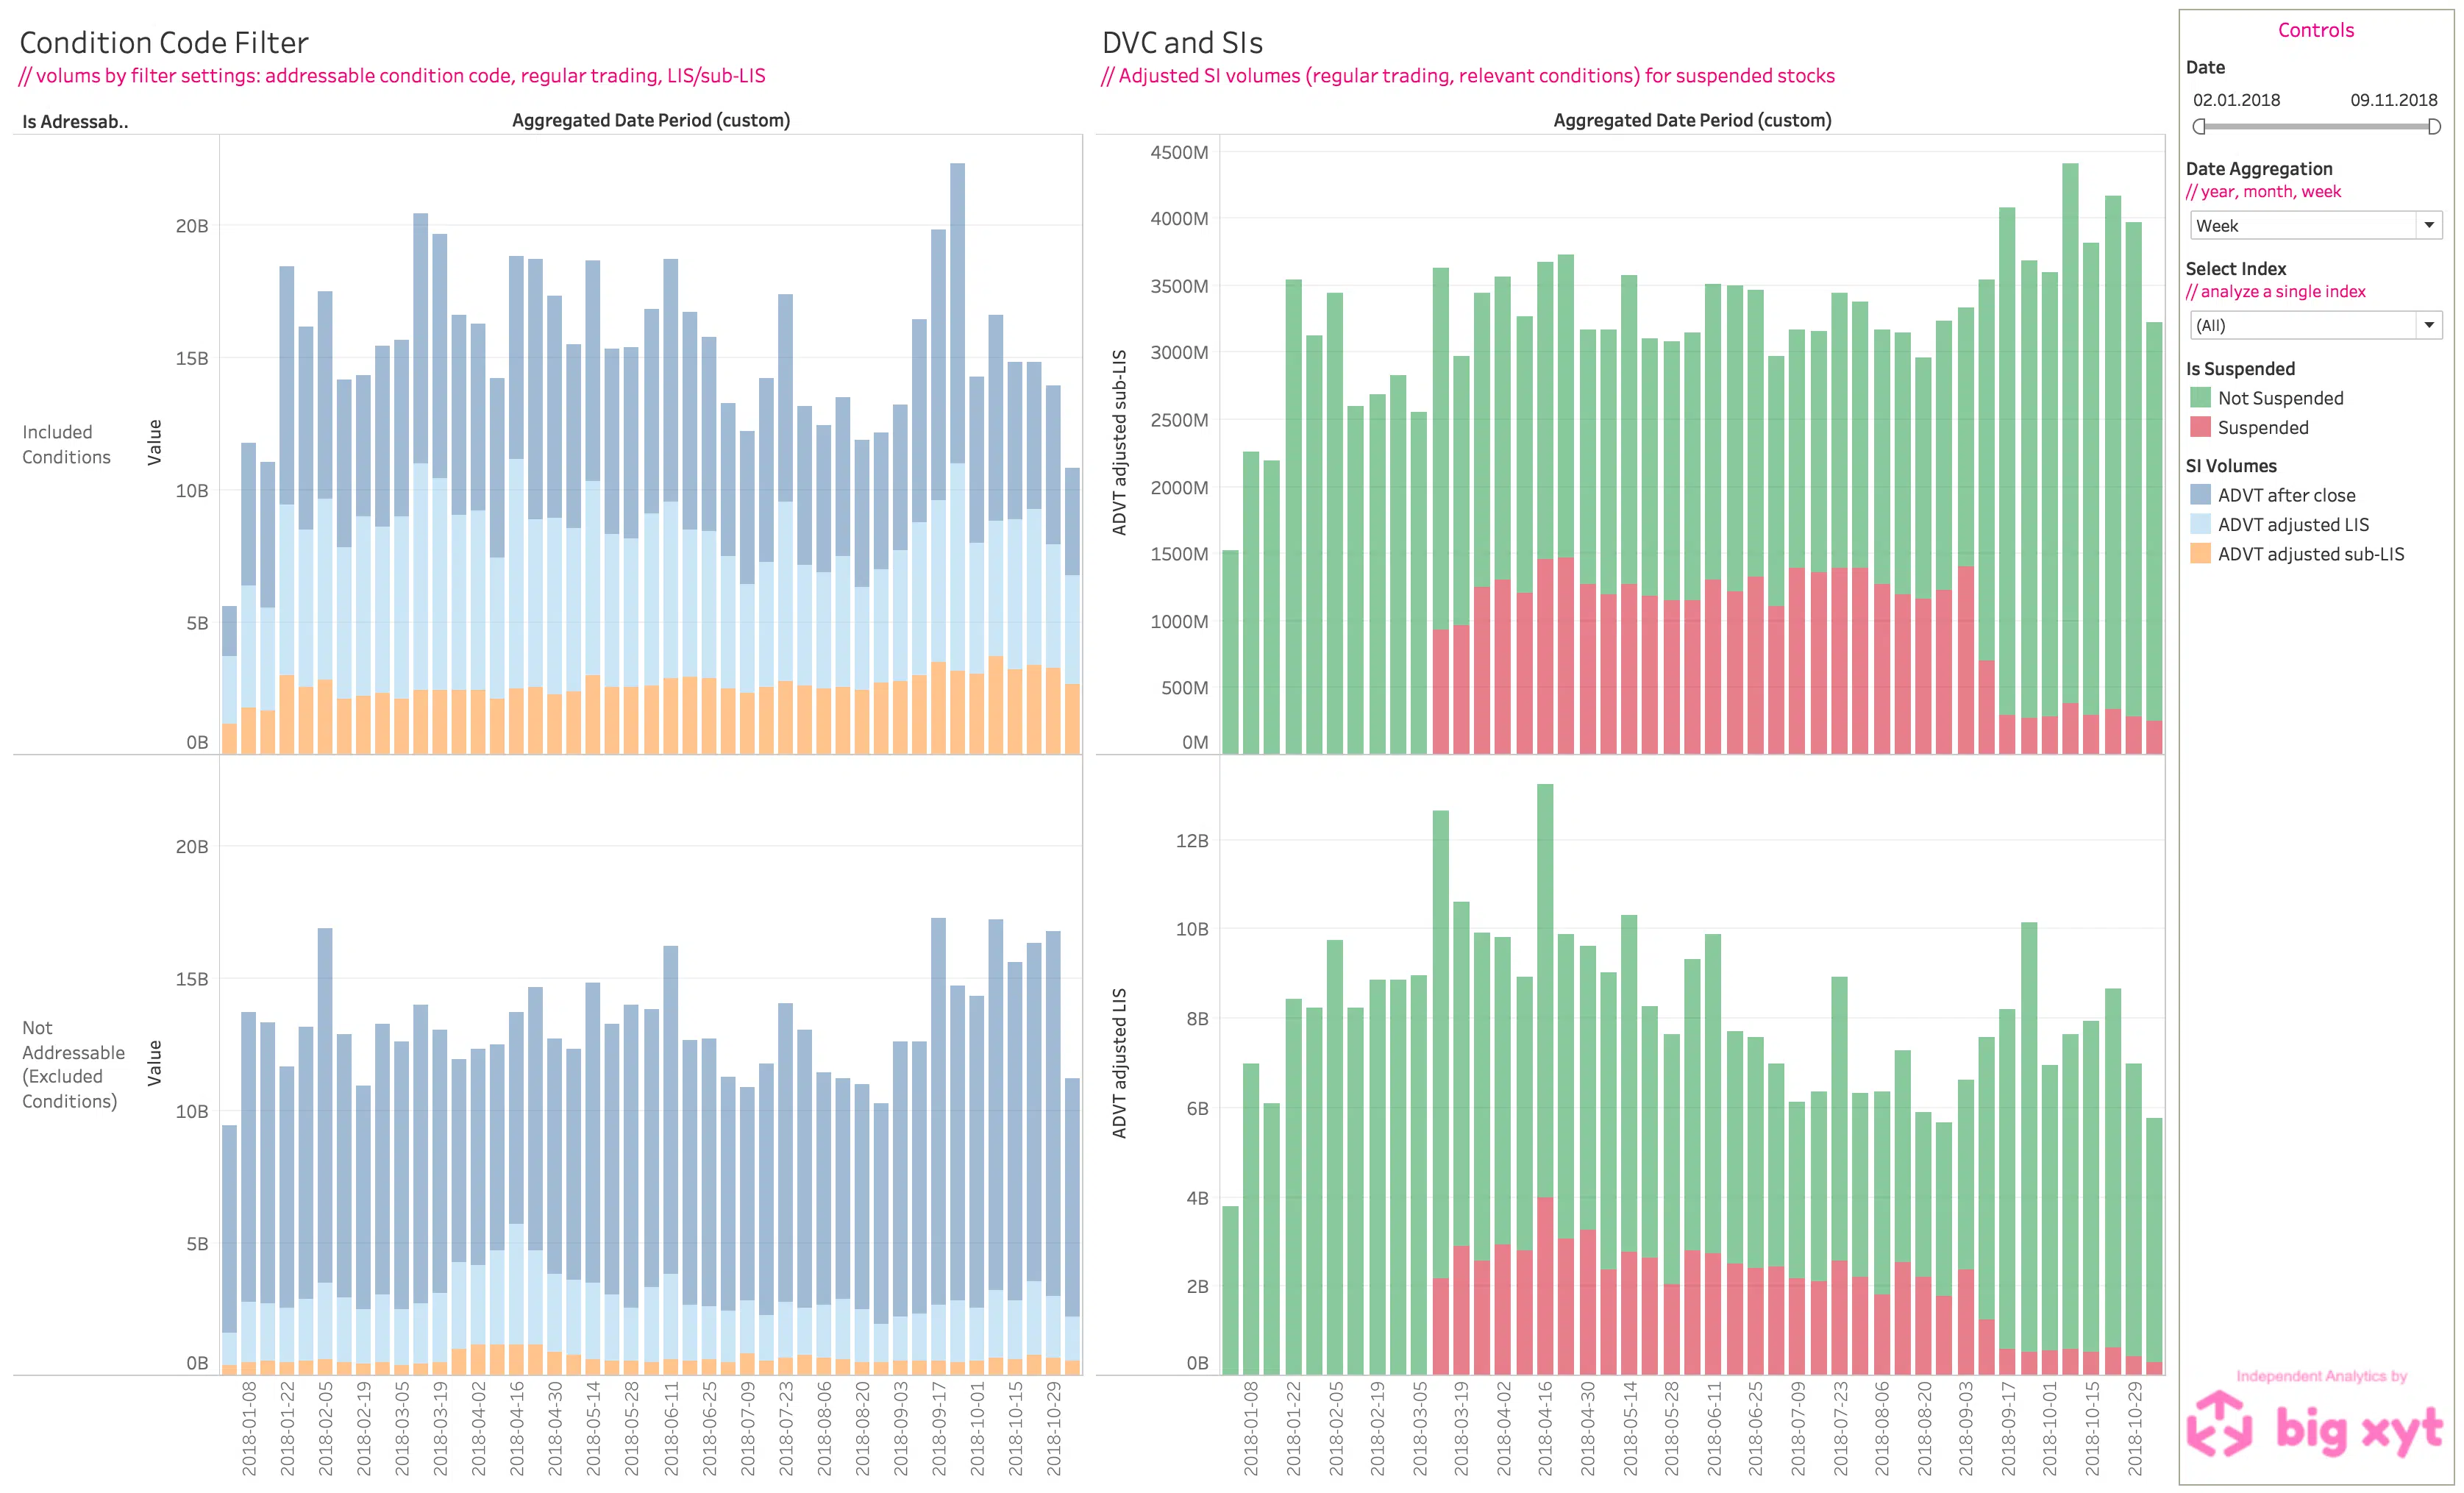
London, Frankfurt, 15 November 2018 big xyt, the independent provider of high-volume, smart data and analytics capabilities is pleased to announce further client driven enhancements to its Liquidity Cockpit. With the introduction of a dedicated dashboard for analysing SI volumes, eligible users have the option to view and compare the reported SI volumes filtered by adjusted conditions, analysed by time, by region or by symbol. This new dynamic visualisation leverages the recent release extending the adjustment of SI volumes and the range of enquiry options and filters available. Users are now able to better understand the component parts of total SI flow reported. Furthermore, this additional value added functionality introduces comparisons to other market activity such as Large In Scale (LIS) trades and the impact of Double Volume Caps on liquidity dispersion over time.
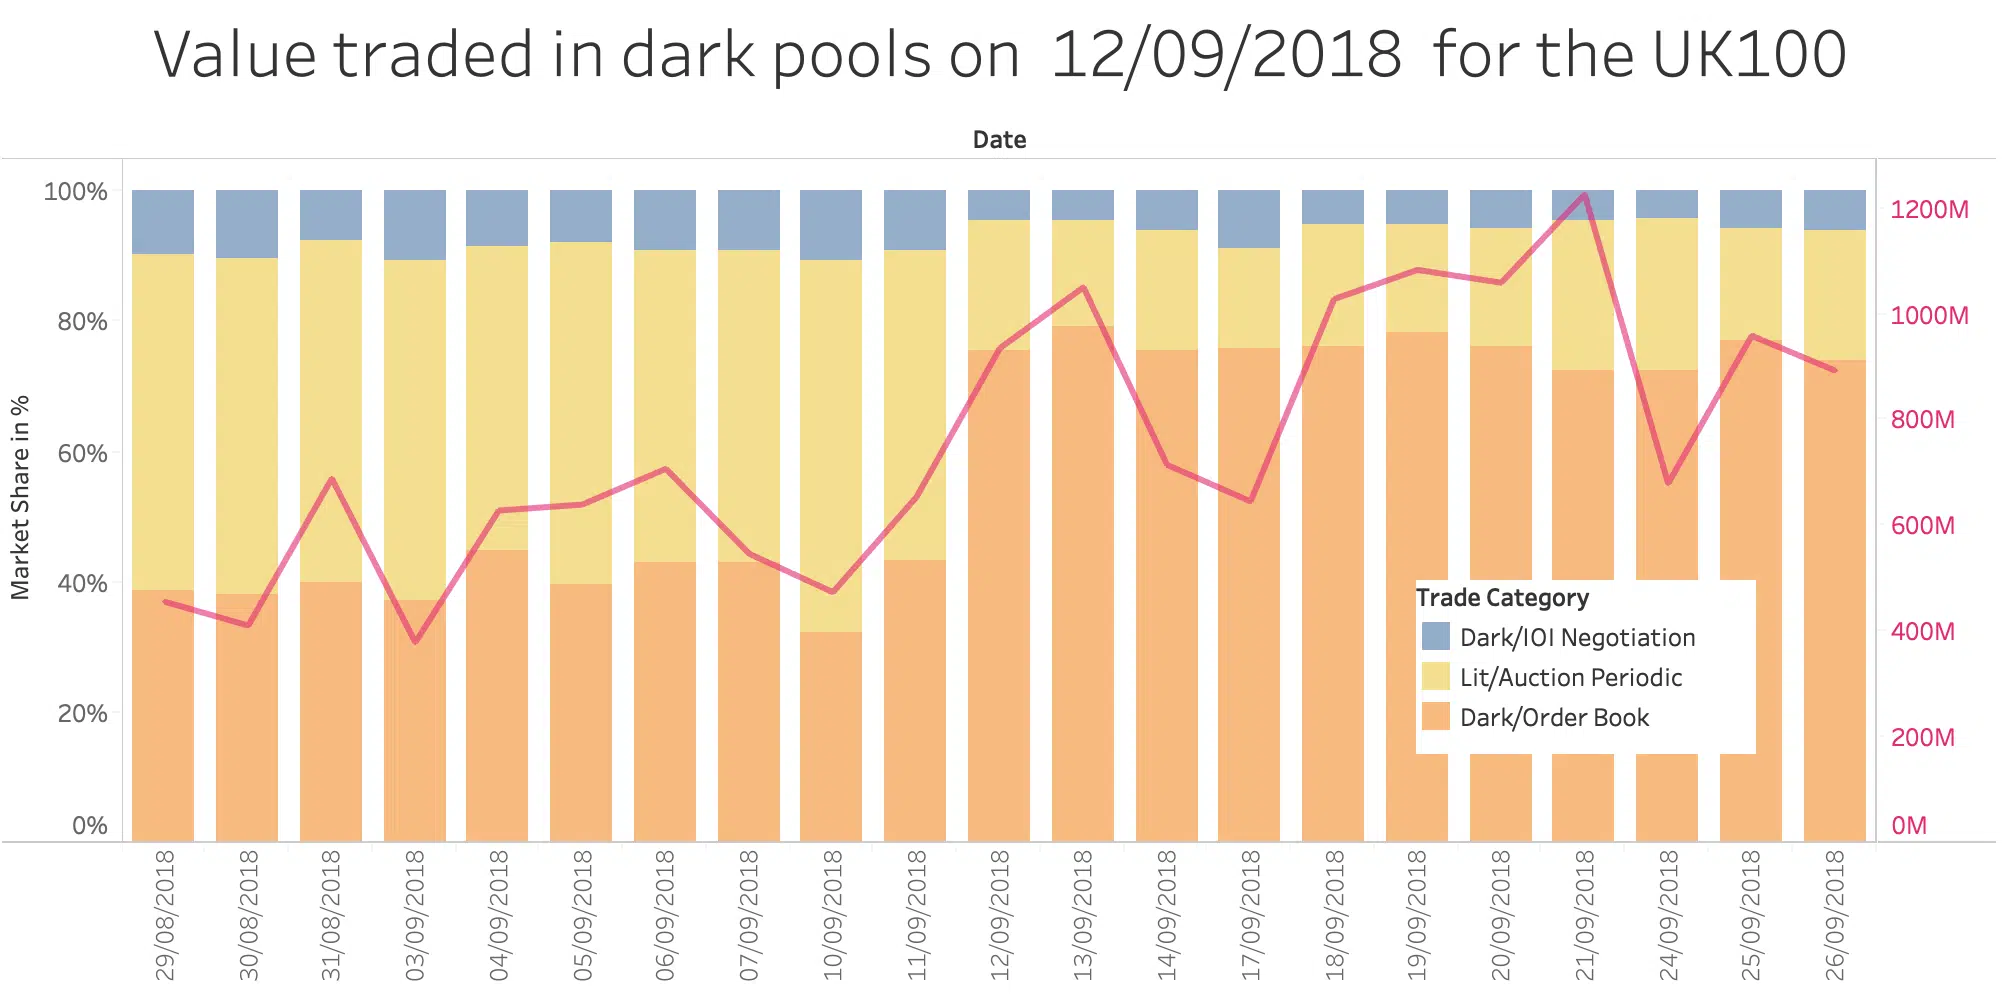
The introduction of the double volume cap (DVC) mechanism as part of MiFIR has heralded a new era in European equity trading, limiting for the first time the universe of securities that can be traded on dark pools. Nearly eight months on from the first DVC suspensions, we can begin to assess how the new regime is working and how the market is adapting. When it first kicked off the DVC framework in March 2018, the European Securities and Markets Authority (ESMA) acknowledged that data quality and completeness issues had delayed implementation by two months, but since then it has kept its public register regularly updated to give market participants full transparency on instrument suspensions.
Enormous volumes of data might be the lifeblood of quantitative analytics, but for the typical trader, dealing with data in any asset class can be complex, costly and daunting. With the explosion of data in recent years and the continuing appearance of new data sources, the challenge for practitioners is growing all the time and they need the power to identify and extract the data that is most relevant to them. Attempting to isolate data using standard spreadsheets is much like using a bucket and spade to find a grain of sand on a beach – it simply can’t be done. Traders need to understand how data has been sourced and they must be able to curate and store large volumes of data in an accessible and manageable format so that they can
The rise of quantitative analysis is mirrored by a rise in demand for its fuel – data. With one feeding the other, investment firms and banks are increasingly reliant upon products and services that can be tested and proven in a way that for many markets was impossible ten years ago. As a result, the use of outsourced tick data provision is becoming prevalent in order to support that rapid growth. Tick data – capture of the price, time and volume for every order and execution across the instruments on a given trading venue – can provide enormous value for exchanges, broker-dealers and asset managers in this context. Ten years ago, it was seen as the preserve of firms building execution algorithms. Now that demand reaches across an enterprise. From compliance to business growth, tick data sits behind many key decisions.
