
Following the theme of Closing Auctions and new Alternative Closing Mechanisms, we can highlight a noteworthy entry to the Closing Auction records books last Friday. In the chart today we see the 5 largest single stock closing auctions in recent (4 years) history. Notably, Linde AG has featured twice (holding the previous record of @4.3bn traded). Unilever plc/NV was the cause of the stir as it collapsed its NV holdings into the plc to consolidate its HQ in the UK whilst maintaining a quoted presence in Amsterdam….all in the interest of simplification, naturally.

Picture the scene. Lap 20, Hamilton, as usual, has a 15 second lead (almost enough time for a free pit stop), and a little more unexpectedly, Bottas is running a strong second, 10 seconds ahead of the third place car. Then, shock, horror, for the first time in five years, both Mercedes have to return to the pits with a mechanical issue on the same lap. For the rest of the field, the race is on again. The rare opportunity for a podium presented on a plate. But, hold on, what is happening? One by one they all return to the pits and wait patiently until Lewis and Valtteri have their proverbial pipes cleared and are ready to rejoin. The clock counts down and the race resumes as if a virtual safety car was being controlled and temporarily parked by the pit crew of the lead team.

If you are benchmarking against the Official Close, how are you ensuring you have an independent view of which stocks, how much, and if anything is trading at the closing price on another venue? Demand for the official close as a benchmark has led to the introduction of alternative closing mechanisms by MTFs to challenge the predominant position of Exchanges. We began examining this area in more detail last year, and as new players have come to the table, we have been enhancing the scope of our radar.

This year, market sentiment has somewhat overwhelmed long-term business strategy and sound financial management, especially in the energy sector. We looked at six energy majors where prices have fallen 39% – 65% from pre-crisis levels. While grappling with the collapse in oil prices, consumer demand and addressing the climate emergency, companies have also had to find the time to reassure their investors. This year, market sentiment has somewhat overwhelmed long-term business strategy and sound financial management, especially in the energy sector. We looked at six energy majors where prices have fallen 39% – 65% from pre-crisis levels. While grappling with the collapse in oil prices, consumer demand and addressing the climate emergency, companies have also had to find the time to reassure their investors.

The markets responded with the usual enthusiasm for major news yesterday with the announcement of Jenny Chen joining our team to extend our reach in the US market. In other news, we saw a likely result in the US presidential election and word of a vaccine. As with Q1, the stories precipitated dramatic increases in traded volumes, price volatility and sector rotation. But did you allow for the same changes in market conditions when trading?
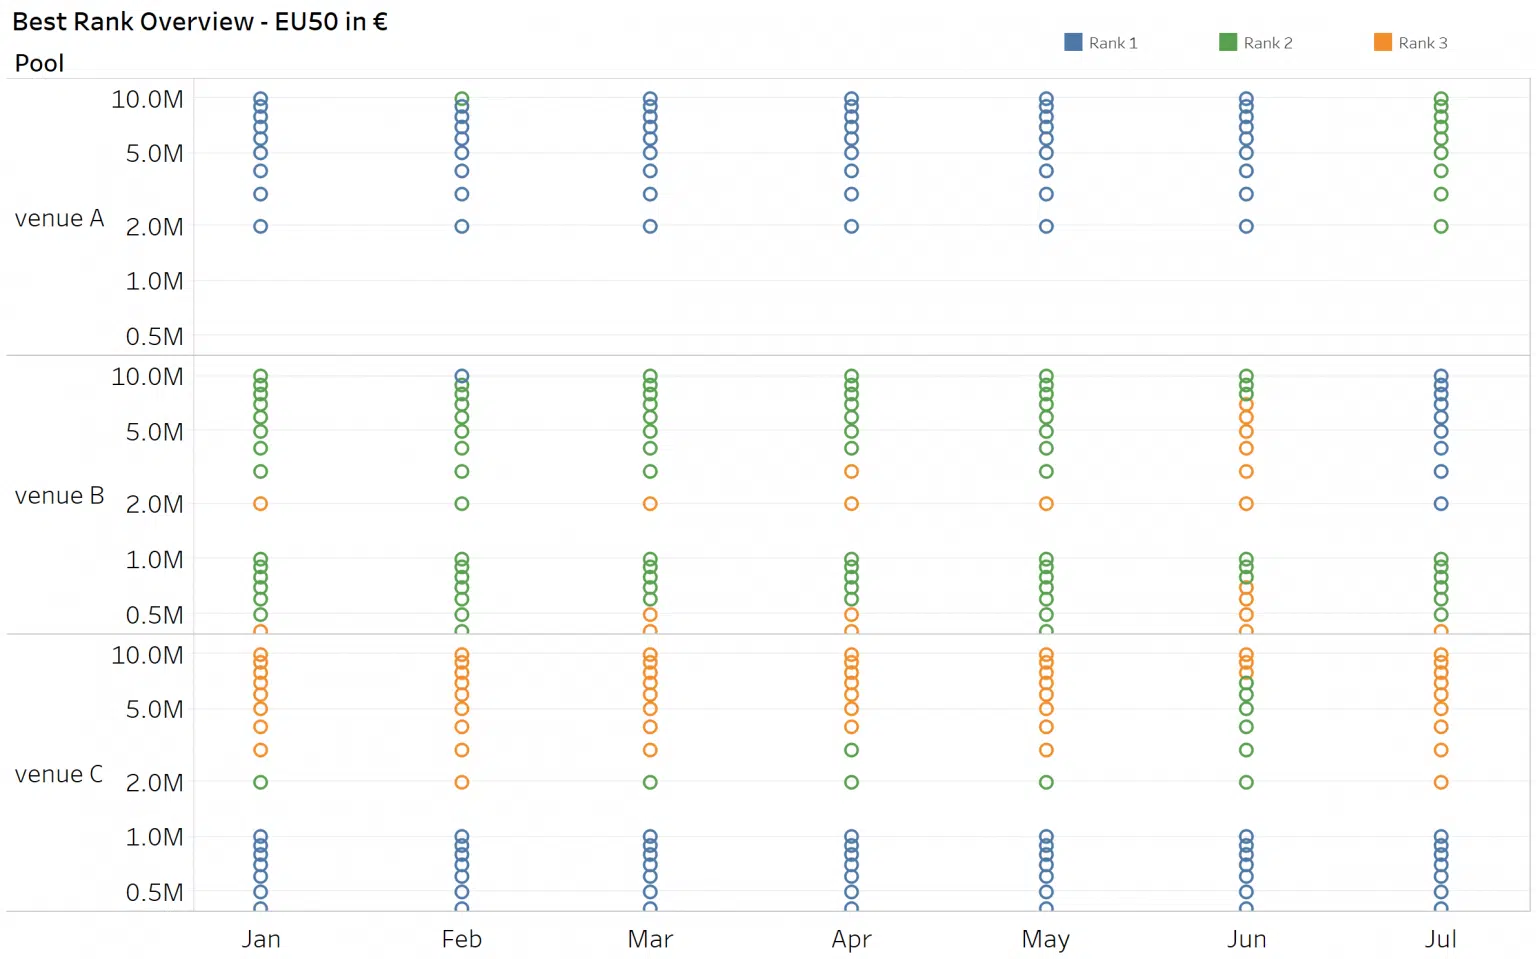
Having a good understanding of how to select a venue when executing a large trade is essential for successful performance. There are many venues to consider and each venue has its own “sweet spot”, depending on the names and size traded and that varies according to your level of urgency. Using objective criteria, such as expected time to execution and likely price impact, we can rank venues into an order of priority for routing. Furthermore, when we look at how this changes over time, we get a sense of the importance of regular monitoring and updating of the smart order routing process.
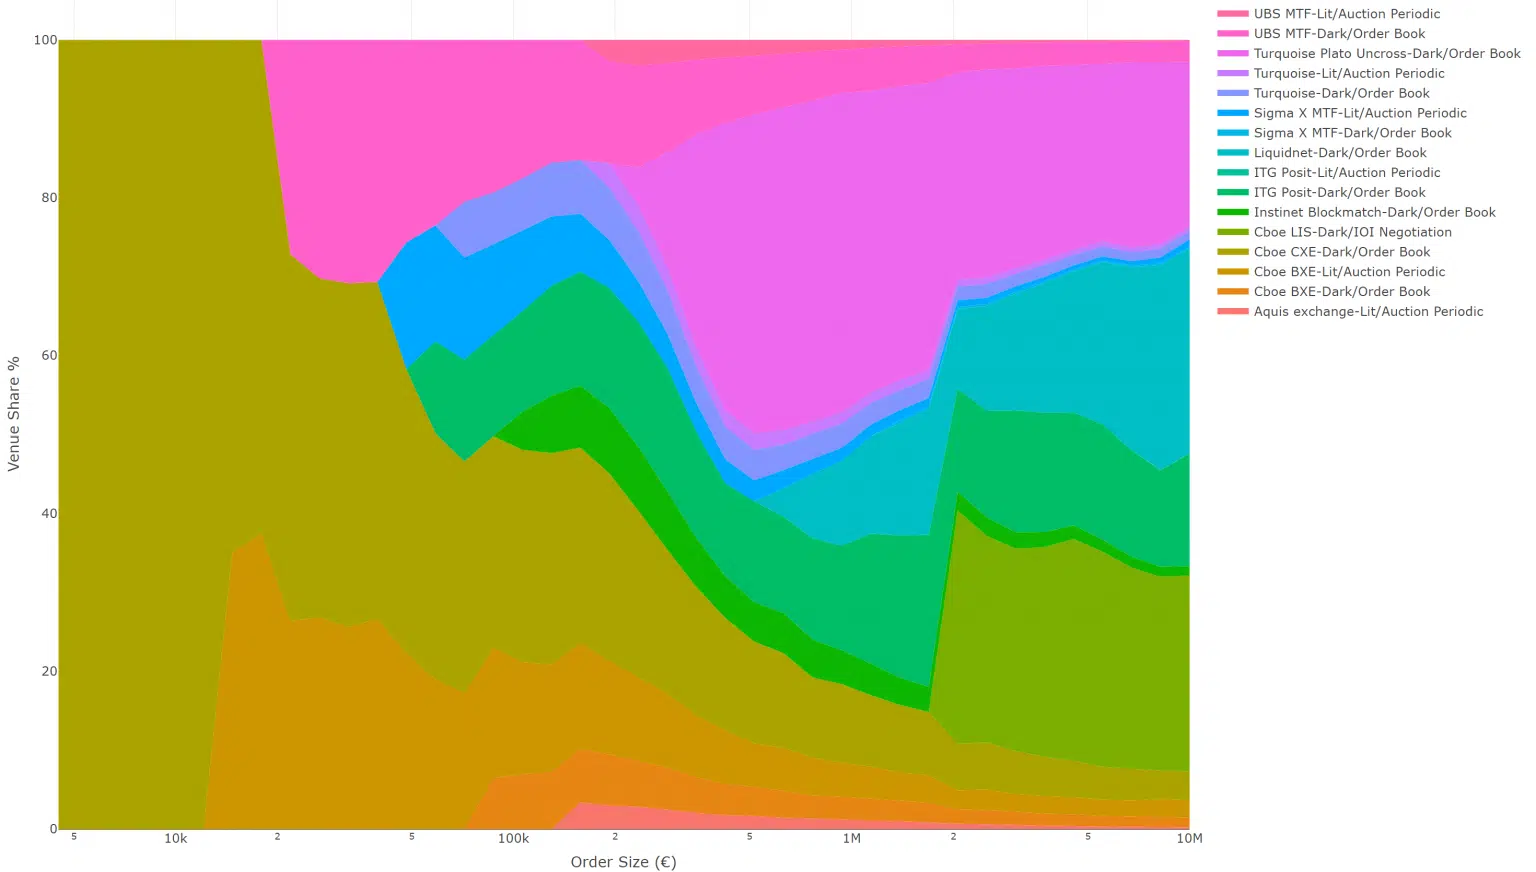
We know that trading behaviour, microstructure and liquidity all vary significantly between venues and across individual stocks. Understanding these differences has become a very important prerequisite to any market participant. Armed with this knowledge, traders can substantially reduce their execution costs, product managers can design better strategies and trading venues can improve their liquidity sourcing. Traders and practitioners are always faced with the question of which venues to pick and how to rank them. The answer to that question is a little more complex than initially thought and the best short answer one can give is: well, it depends. We know that each venue has three important factors that influence the ranking: the speed of execution (or the number of trades per day); the distribution of order sizes and price improvement which measures the implicit costs of trading in the venue. These are all objective measures that can be approximated from public data.
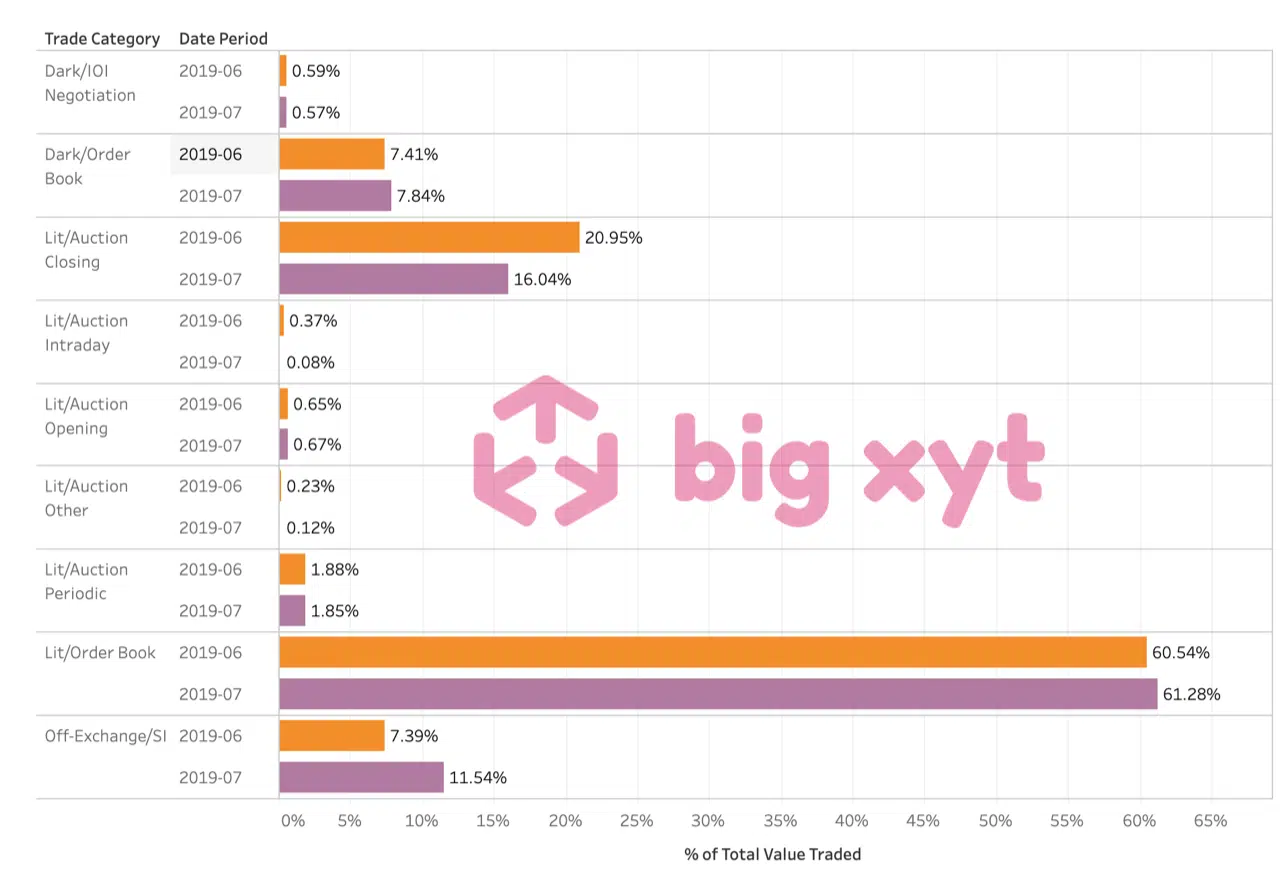
big xyt shares independent insights on European trading derived from a consolidated view on cash equity markets. The measures covered below are used as a reference by exchanges, brokers and buyside firms, reflecting answers to relevant questions occuring in the post-MiFID II era. The methodology is fully transparent and applied to tick data captured from all major venues and APAs (Approved Publication Arrangements). During the first half of 2018, market participants and observers are continuing to evaluate the changing liquidity landscape of European equities. One of the key questions this year is around the introduction of a ban on Broker Crossing Networks (BCNs), thereby outlawing the matching of a bank or broker’s internal client orders without pre-trade transparency for the rest of the market. Would this ban effectively force BCN activity onto the lit markets (public exchanges), as intended by the regulator with its desire to maximise the transparency of all orders, both pre- and post-trade,
Over the past five years, the pace of change in the European equities and ETF markets has been almost unparalleled. This in turn is fuelling demand from the buyside community for greater transparency in the form of data and metrics in order to achieve best execution, optimise their trading activities and ultimately make better informed decisions. Yet obtaining the quality of detailed, reliable and completely independent data required to analyse market structure changes has created its own set of additional challenges, not only for the buy-side and sell-side, but also for exchanges, trading venues and even policy makers and regulatory bodies. For many, the idea of a ‘consolidated tape’ is often the first solution that springs to mind. But would it be the panacea that firms seem to expect?
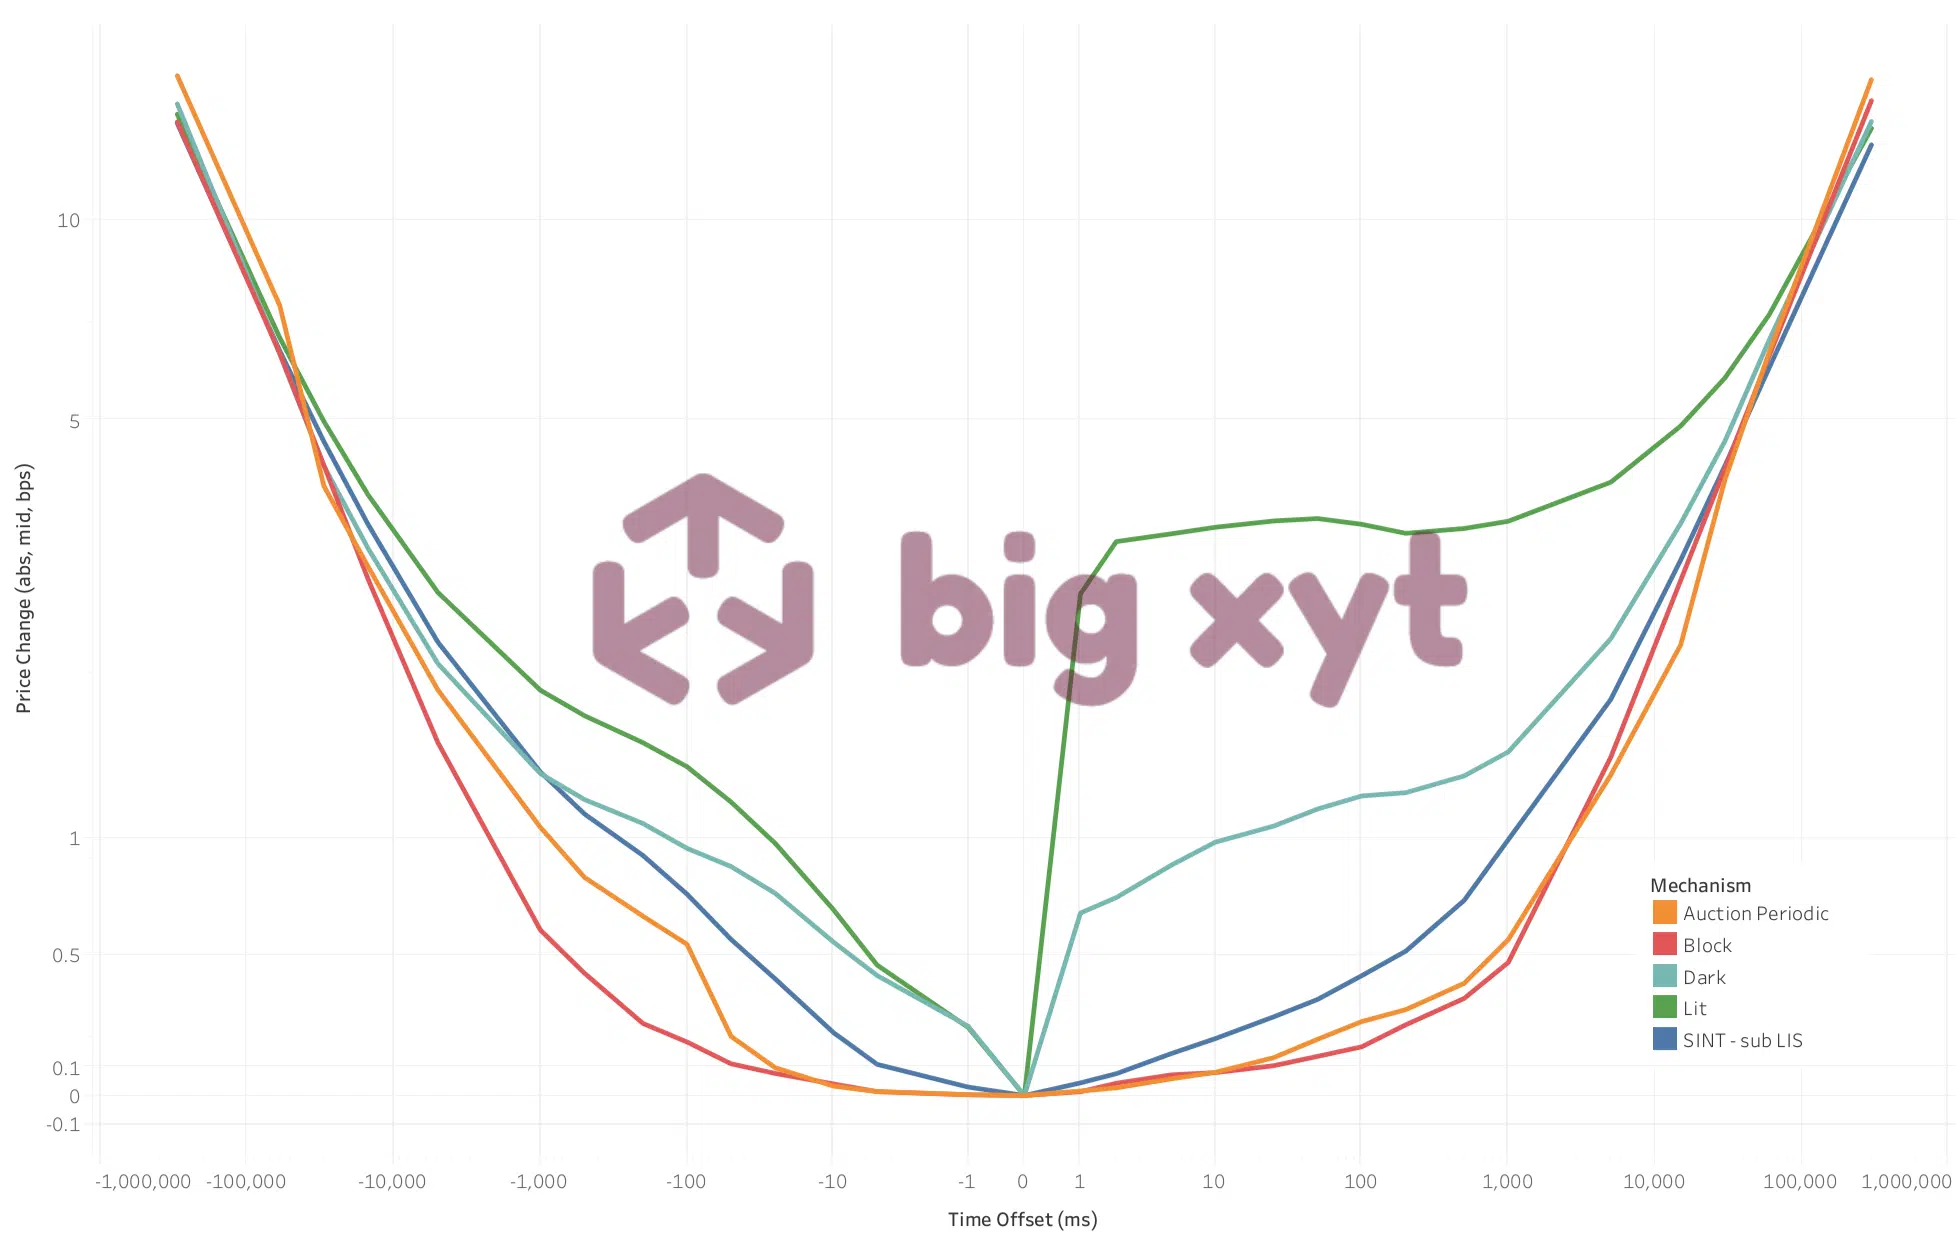
For participants in the European equities markets, the use of smart measures around price movements before and after each trade can help to better inform execution decisions, and therefore optimise and improve execution quality. By capturing every tick in the market for each stock across all venues, we can see how a share price moves before and after each trade. In normal circumstances, most liquid stocks can be expected to trade at least once within a five-minute period, certainly it is likely that a movement will occur in the bid or ask and therefore the midpoint. We can measure either the percentage likelihood of a move within the time period or the magnitude of the price change in basis points at a given interval.