Day 6 of 12: Breaking Down Systematic Internaliser Volumes by Condition Codes
Some observations:
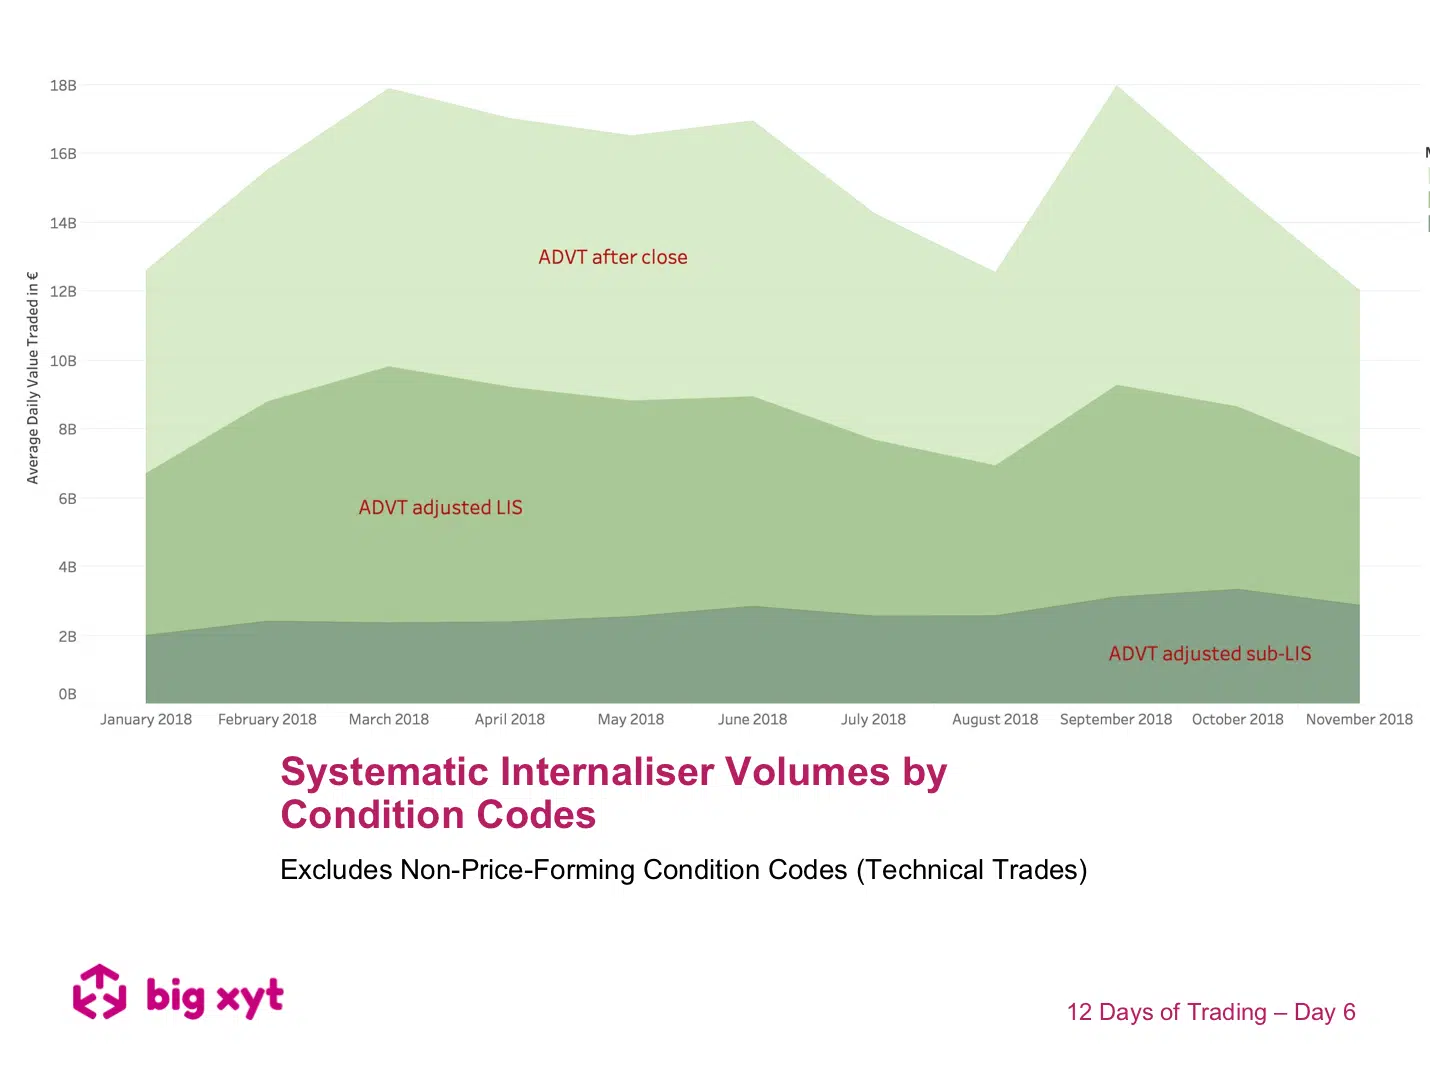
- Pan European average reported volumes by Systematic Internalisers now total around €30bn, representing 30% of equity turnover.
- Of this SI volume, approximately 50% can be removed by identifying condition codes or trade flags that indicate the transaction was non-price-forming ( we can provide a long list of these that we have identified for exclusion).
- If we then identify trades reported outside market hours, we are left with a further reduction (see chart).
- Many observers see Large In Scale trades reported by Systematic Internalisers as representative of a bilateral negotiation and therefore not representative of liquidity available to all at that price.
- Filtering out the Large In Scale SI trades leaves daily adjusted volumes of around €3bn ie 3-4% of total equity turnover.
- This adjusted sub category of sub-LIS SI trading has shown steadily growing volumes.
—
Do you want to receive future updates directly via email? Use the following form to subscribe.
On our 12 Days of Trading
As the year draws to a close we have been asked by clients to look and highlight 2018 trends since the introduction of MiFID II. We thought we might make this a festive exercise on the 12 days leading up to the holidays. As a result, you will find a post to a different 2018 big-xyt observation each day.
We hope you enjoy them.
—
This content has been created using the Liquidity Cockpit API.
About the Liquidity Cockpit
At big-xyt we take great pride in providing solutions to the complex challenges of data analysis. Navigating in fragmented markets remains a challenge for all participants. We recognise that the investing community needs and expects continued innovation as the volume of data and related complexity continues to increase.
Our Liquidity Cockpit is now recognised as an essential independent tool for exchanges, Sell-side and increasingly Buy-side market participants. Data quality is a key component, as is a robust process for normalisation so that like-for-like comparisons and trends over time have relevance. However, our clients most value a choice of flexible delivery methods which can be via interactive dashboard or direct access to underlying data and analysis through CSV, API or other appropriate mechanism.
For existing clients – Log in to the Liquidity Cockpit.
For everyone else – If you would like a trial of the Liquidity Cockpit, please use this link to register your interest.


