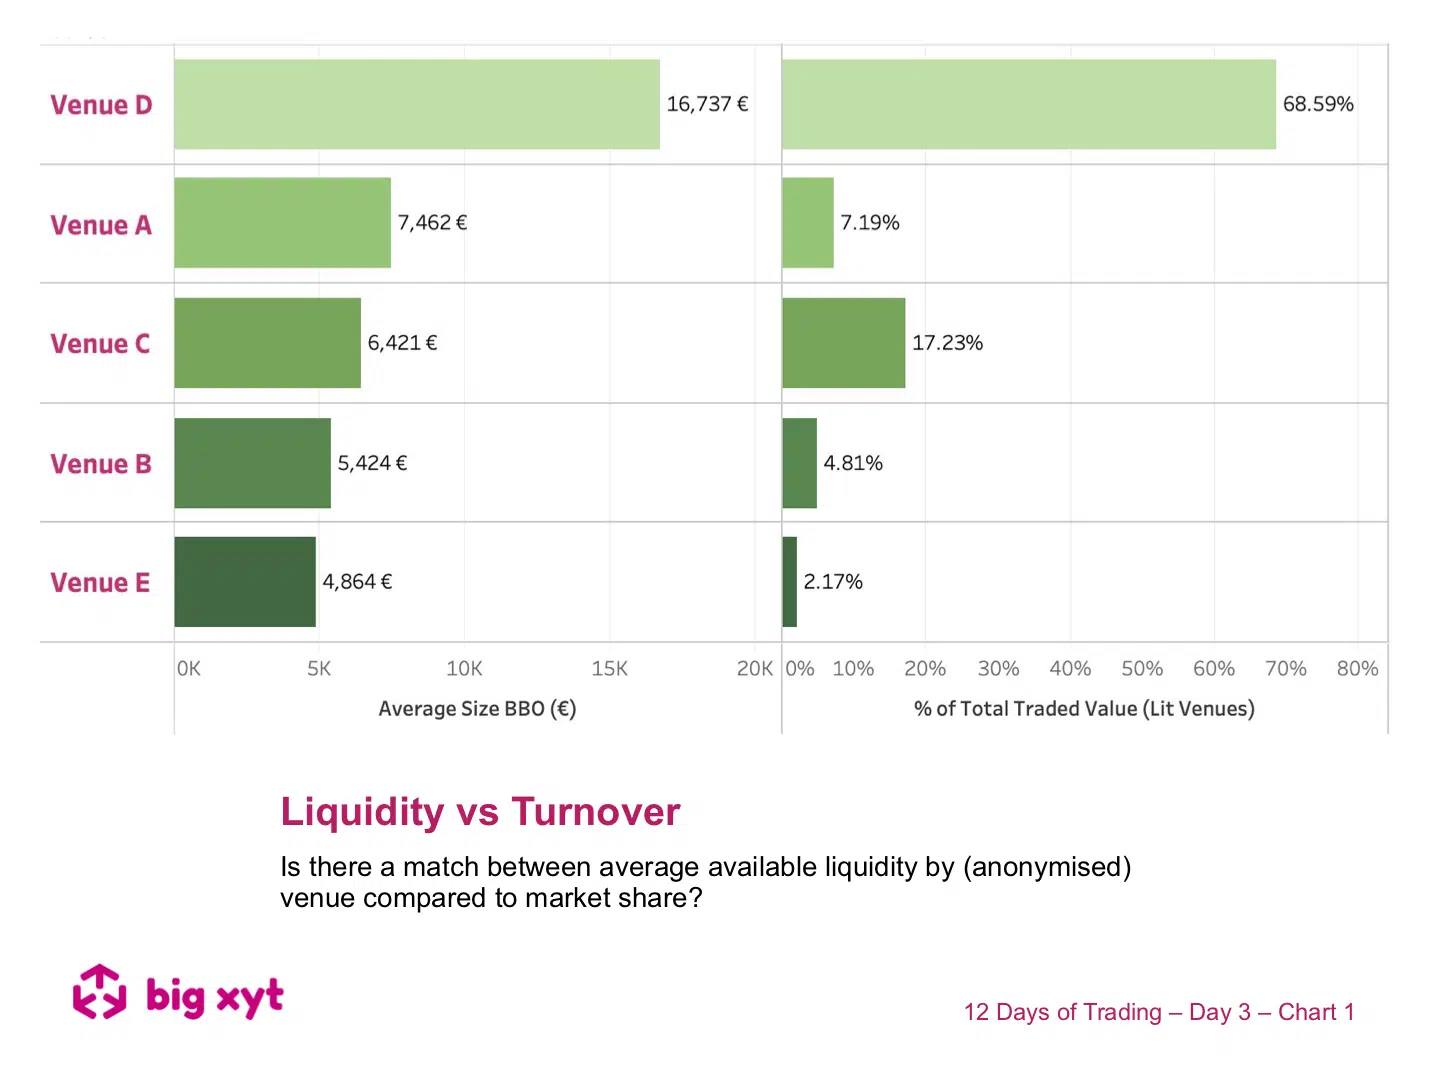
We have demonstrated in previous posts that there is a correlation between spreads and market share. The venue with the highest turnover tends to have the best prices. However, as the regulators keep reminding us, best execution should factor in liquidity as well as price. In the chart today we take a look at one European market and find that the rankings for turnover do not always match the rankings for available liquidity at the touch across the anonymised venues. Our Liquidity Cockpit allows the identity of these venues to be revealed to enable you to ask if you are sourcing the best liquidity, at the best price, by market, by venue, by index or at stock level. — Do you want to receive future updates directly via email? Use the following
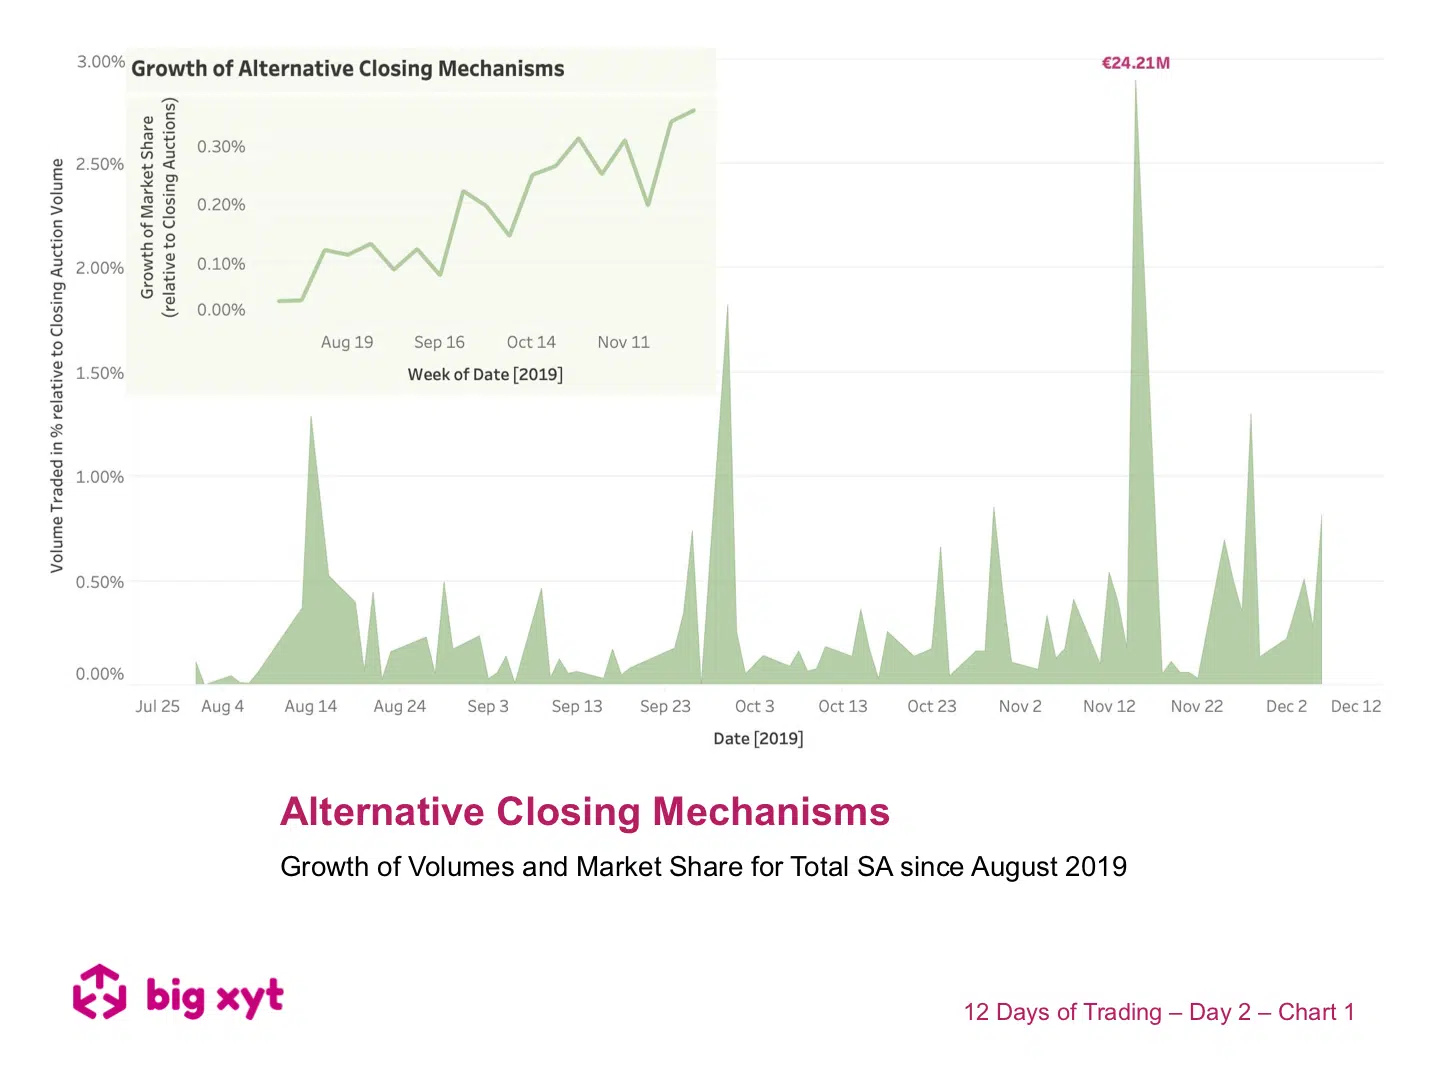
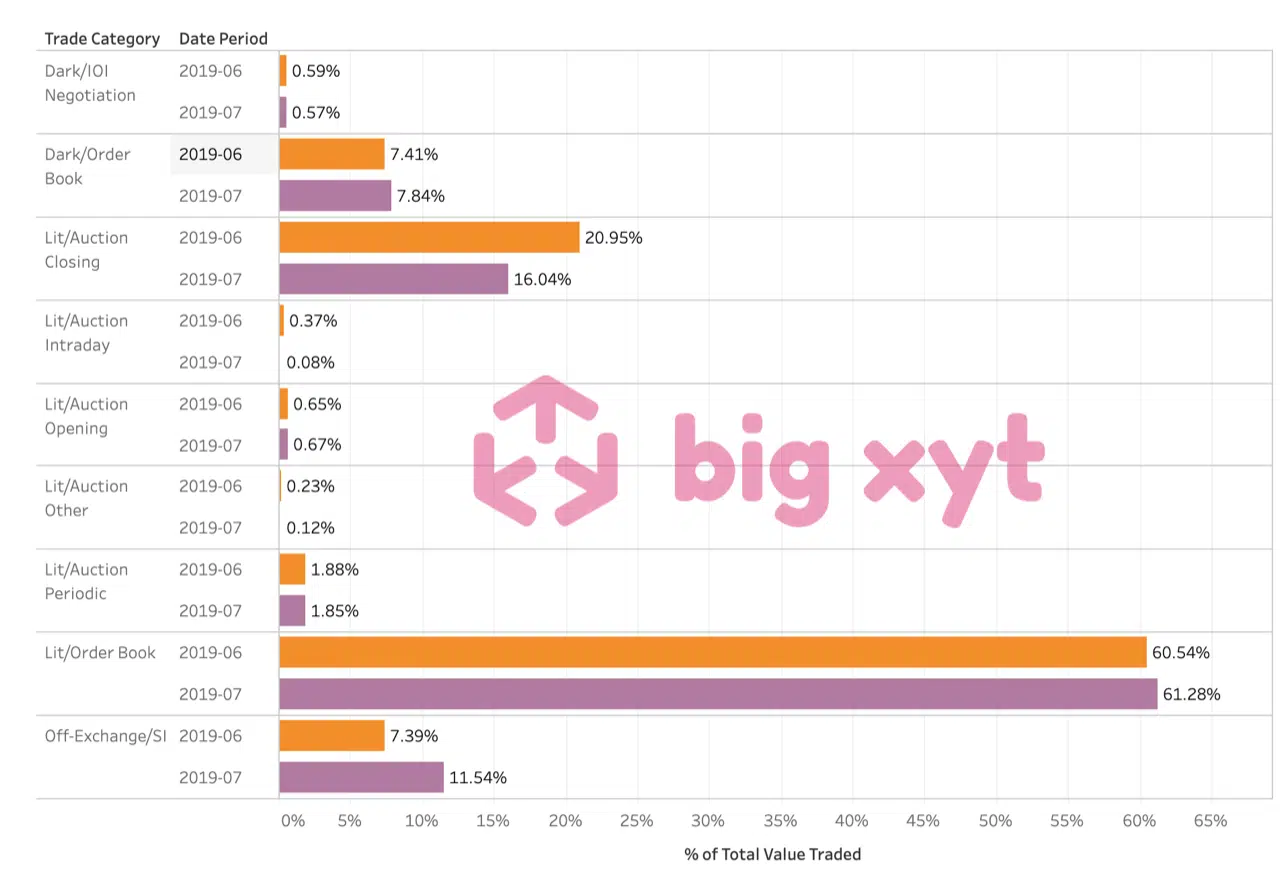
MiFID I opened the door to exchange competition in Europe. Whilst the central limit order books of the exchanges have seen their monopolies challenged, one area has remained the domain of the primary exchanges. However, with increasing focus on closing auctions driven by passive investing and ETFs, it is not surprising to see innovative attempts to provide alternative means to deliver execution at the closing price. Many exchanges already support a post trade phase (Trading at Last) sweeping up remaining interest once the price has been established. Aquis and Cboe have recently introduced their own twist on the Primary mechanisms. Today’s chart shows that investors looking for liquidity at the closing price need to be aware of the growth of alternative mechanisms (shown in the inset), and taking the example of Total we see growth overall and in the monthly peaks traded
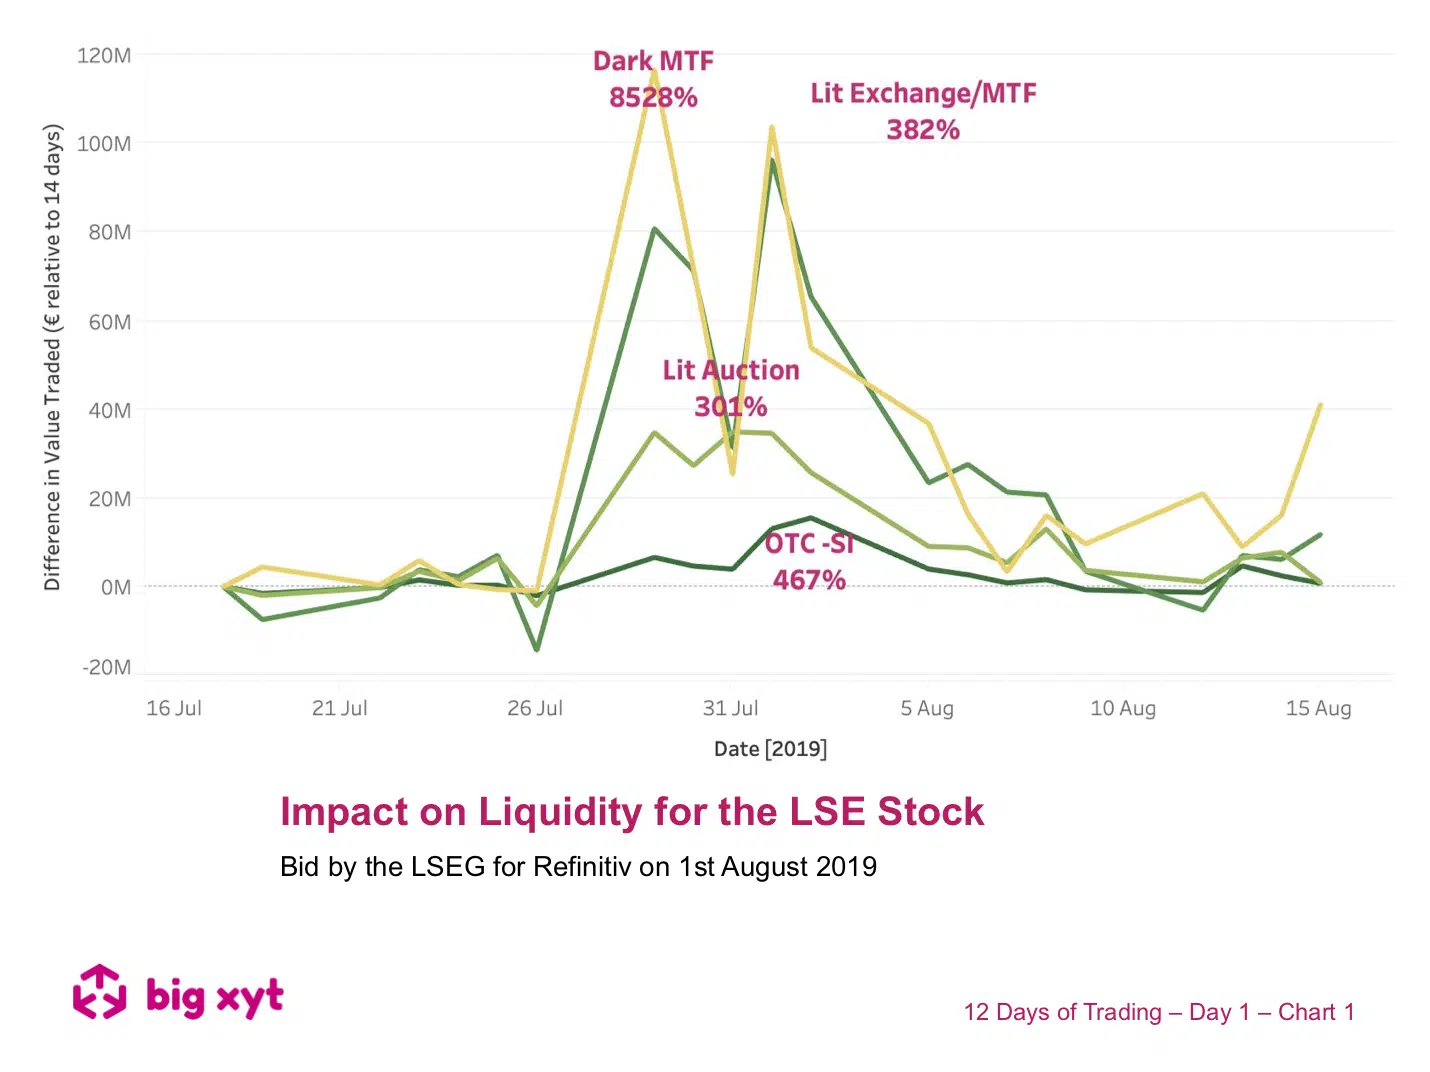
Liquidity on lit order books is driven by pre-trade transparency. Therefore, tighter spreads or deeper visible liquidity can lead to market share growth on one venue at the expense of another. Alternative mechanisms also play their part in particular circumstances. Take the example here where major news on two occasions throughout the year caused a basis change in the price of the London Stock Exchange Group (ironically the owner of three major European Equity venues). Traders noting a new price level wanted to trade and trade in size. With the news leading, to increased activity, the fragmentation of liquidity changed in a somewhat unexpected way. Market Share in lit books and block volumes increased dramatically compared to other mechanisms. Of further note was that this increase persisted in block venues, not just for the duration of the day of the announcement but for subsequent days until matched block liquidity was exhausted at that price level.

London, Frankfurt, 25th November 2019 – big xyt, the independent provider of market data analytics is pleased to announce that it has been named as ‘Editors Choice – Outstanding TCA provider’ at The TRADE Leaders in Trading 2019 Awards. Robin Mess, CEO at big xyt, who collected the award with Mark Montgomery, Head of Strategy and Business Development, at a ceremony in London last week commented, “We are delighted to have received this recognition as Outstanding TCA provider from the Editors at The TRADE and thank our clients and XYTView users for their support this year.” John Brazier, Editor of The TRADE said, “Throughout the year we have heard a lot from the buy-side about the value of TCA to their trading processes, and big xyt was one of the names that was continuously raised in this discourse.” He added, “The TRADE editorial team were impressed with big xyt’s quality of service and high level of dedication to providing the buy-side community with tools they need to achieve best execution and deliver the best returns to clients as possible.”
big xyt shares independent insights on European trading derived from a consolidated view on cash equity markets. The measures covered below are used as a reference by exchanges, brokers and buyside firms, reflecting answers to relevant questions occuring in the post-MiFID II era. The methodology is fully transparent and applied to tick data captured from all major venues and APAs (Approved Publication Arrangements). During the first half of 2018, market participants and observers are continuing to evaluate the changing liquidity landscape of European equities. One of the key questions this year is around the introduction of a ban on Broker Crossing Networks (BCNs), thereby outlawing the matching of a bank or broker’s internal client orders without pre-trade transparency for the rest of the market. Would this ban effectively force BCN activity onto the lit markets (public exchanges), as intended by the regulator with its desire to maximise the transparency of all orders, both pre- and post-trade,
ondon, Frankfurt, 3rd October 2019 – big xyt, the independent provider of market data analytics, today launched XYT View, a specialist aggregated view of fragmented market information that participants need to ensure that they are achieving the best possible outcomes for themselves and their clients. The company is also pleased to announce that Steve Grob, CEO at Vision 57 and “long time” market commentator will be working with the Strategy team to provide market consultancy and additional thought leadership. XYT View provides a meaningful range of market overview metrics and has been developed to fill the information gap caused by the withdrawal of previous alternatives. Delivered via interactive dashboards, users can observe changes in displayed liquidity, periodic auctions, opening and closing auctions across the entire equity and ETF trading landscape in Europe.
Over the past five years, the pace of change in the European equities and ETF markets has been almost unparalleled. This in turn is fuelling demand from the buyside community for greater transparency in the form of data and metrics in order to achieve best execution, optimise their trading activities and ultimately make better informed decisions. Yet obtaining the quality of detailed, reliable and completely independent data required to analyse market structure changes has created its own set of additional challenges, not only for the buy-side and sell-side, but also for exchanges, trading venues and even policy makers and regulatory bodies. For many, the idea of a ‘consolidated tape’ is often the first solution that springs to mind. But would it be the panacea that firms seem to expect?
London, Frankfurt, 21 June 2019. big xyt, an independent provider of high-volume market data analytics, is pleased to announce the launch of Consolidated View, an extension of the market analysis metrics available to all members of the investment community from the Liquidity Cockpit platform and 250days website dashboard. The new views allow access to a standardised independent view of the trading activity across the equity and ETF trading landscape in Europe. big xyt clients, including multiple global exchanges and investment banks, have increasingly been using detailed information and analytics from the Liquidity Cockpit as a reference to validate their trading performance to their clients. By allowing complimentary access via 250days.com to the aggregated data for single stocks, regions and indices, this new initiative delivers independent aggregated information, adding a much-needed layer of efficiency and transparency to the market.
London, Frankfurt, 3 June 2019. big xyt, an independent provider of high-volume smart data and data analytics, is pleased to announce that, Liquidnet Europe Limited, have extended their use of the big xyt analytics Liquidity Cockpit platform to monitor execution quality of its products along with cross-checking market volumes. big xyt are providing Liquidnet execution analysts with an interactive application to monitor market information via the Liquidity Cockpit dashboard. By using data science big xyt solutions capture, normalise, collate, and store trade data at a granularity that has not previously been available in the market.
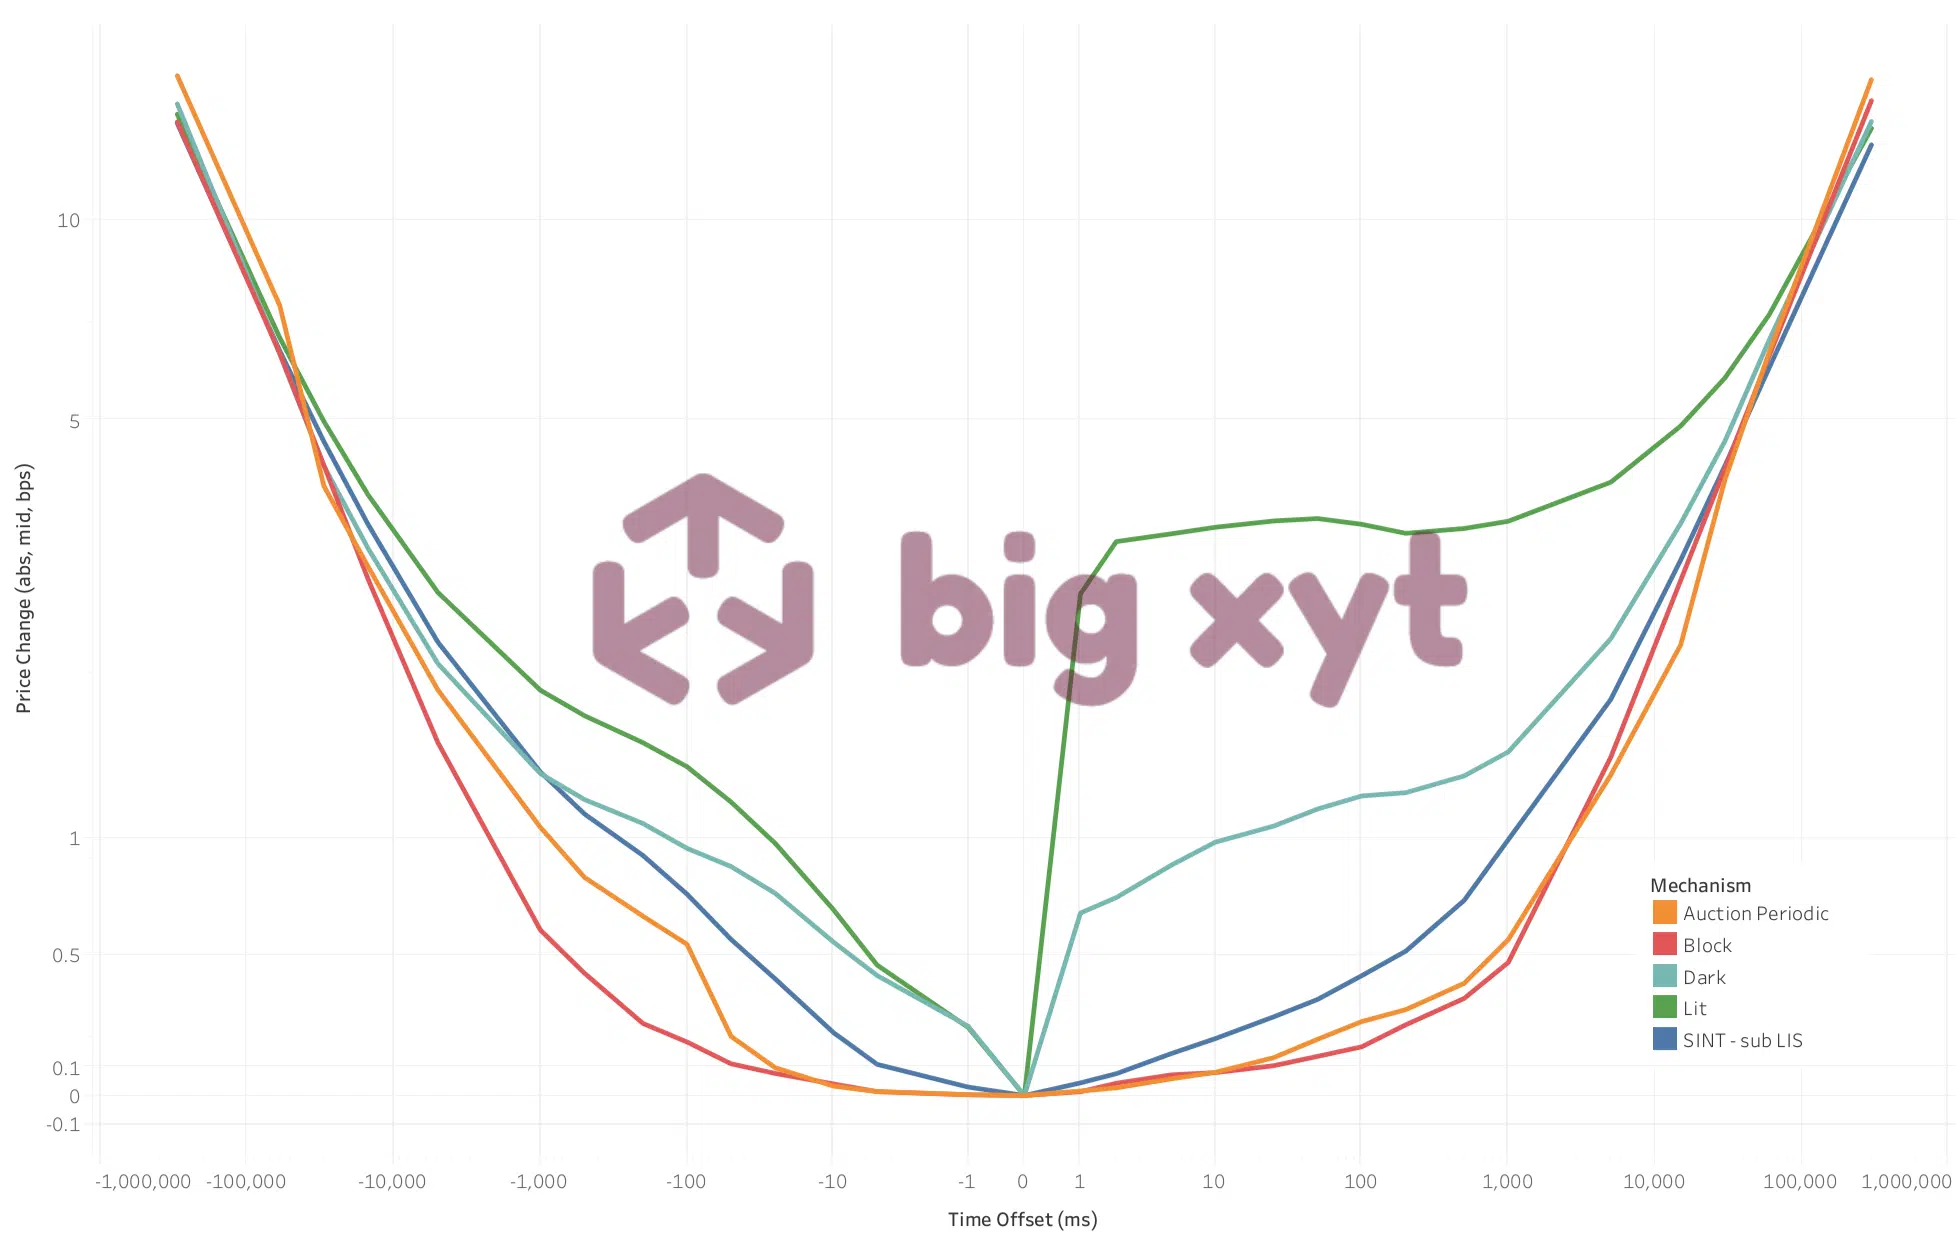
For participants in the European equities markets, the use of smart measures around price movements before and after each trade can help to better inform execution decisions, and therefore optimise and improve execution quality. By capturing every tick in the market for each stock across all venues, we can see how a share price moves before and after each trade. In normal circumstances, most liquid stocks can be expected to trade at least once within a five-minute period, certainly it is likely that a movement will occur in the bid or ask and therefore the midpoint. We can measure either the percentage likelihood of a move within the time period or the magnitude of the price change in basis points at a given interval.