Day 7 of 12: Intraday Lit Volume Profiles
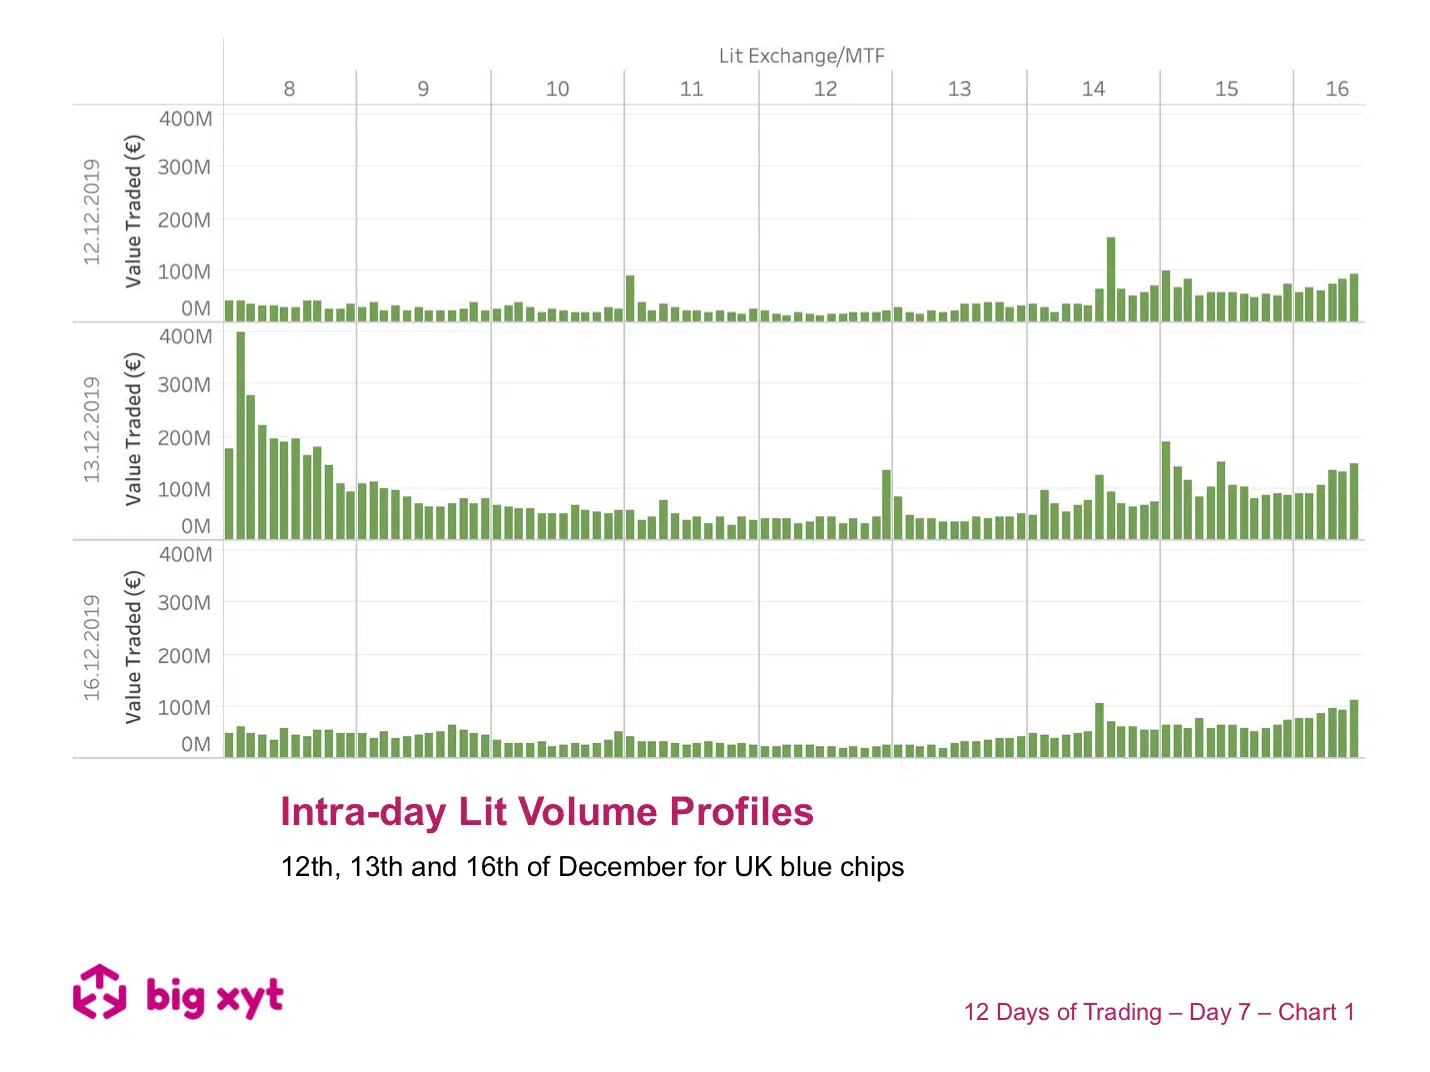
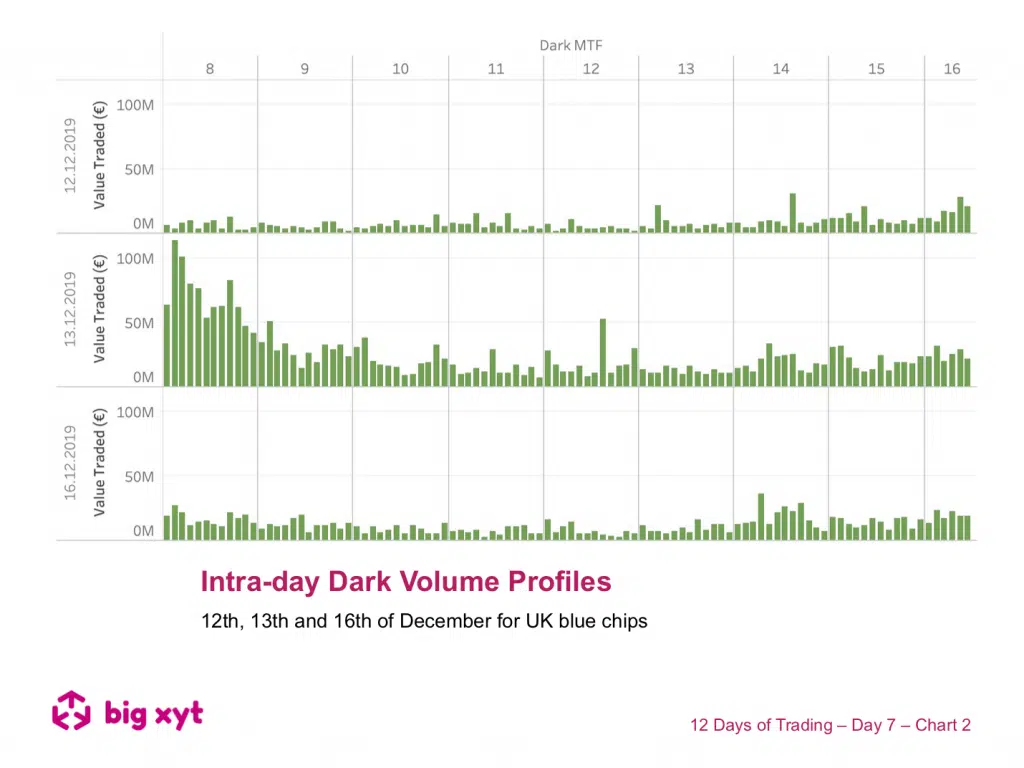
12th, 13th and 16th of December for UK blue chips
There was too much happening on Friday not to revisit how the General Election result shifted traders’ focus from liquidity based benchmarks to urgency of execution.
Having seen the increased opening auction activity on Friday 13th, we wondered if it was unlucky for some router configurations as they did their best to navigate a non-standard day of liquidity profiles? Today we have two comparative sets of charts to introduce and examine the intraday volume profile (in this case for UK blue chips).
If this was your crystal ball you would have used it on Friday, for example, to target the volume weighted average price (VWAP). In chart one we see how lit volumes, split into five minute buckets, vary through the continuous trading session (i.e. not including the open & closing auctions). The top chart is polling day (12th) the middle chart is the next day, when the results of the General Election became known and the third chart shows yesterday’s volume profile.
The second group of charts compares the same three days replacing lit with dark activity.

big-xyt has tools to create these historical profiles by trading mechanism, by index, by sector or by individual stock across user-defined time frames.
Liquidity Cockpit users are able to look at any stock this way and see the venues broken down. Clients using our Execution Analysis/TCA are able to measure execution performance with the demonstrated precision and flexibility.
—
Do you want to receive future updates directly via email? Use the following form to subscribe.
On our 12 Days of Trading
As the year draws to a close we have been asked by clients to repeat our festive exercise on the 12 days leading up to the holidays. As a result, you will find a post to a different 2019 big-xyt observation each day. We look and highlight trends since the introduction of MiFID II with a focus on this year’s changes or events.
We hope you enjoy them.
—
This content has been created using the Liquidity Cockpit API.
About the Liquidity Cockpit
At big-xyt we take great pride in providing solutions to the complex challenges of data analysis. Navigating in fragmented markets remains a challenge for all participants. We recognise that the investing community needs and expects continued innovation as the volume of data and related complexity continues to increase.
Our Liquidity Cockpit is now recognised as an essential independent tool for exchanges, Sell-side and increasingly Buy-side market participants. Data quality is a key component, as is a robust process for normalisation so that like-for-like comparisons and trends over time have relevance. However, our clients most value a choice of flexible delivery methods which can be via interactive dashboard or direct access to underlying data and analysis through CSV, API or other appropriate mechanism.
For existing clients – Log in to the Liquidity Cockpit.
For everyone else – Please use this link to register your interest in the Liquidity Cockpit.


