At this time of year the discussion often turns to how Father Christmas is able to get around so many households in just one night. For sure, the sleigh is fitted with the latest technology such as smart routers and machine learning algorithms to plot the optimal course between well behaved children. But the evidence is building that in his day job the big man may be a high frequency trader.
The time it takes to get between Madrid and London at light speed is around four milliseconds. Of course, that’s the physical limit and there are plenty of items that cause friction such as chimneys and church steeples, or if you are a high frequency trader, firewalls and trading controls. The parallels are obvious.
One way to see the impact of this latency is to look at the time taken for a new European Best Bid Offer price on Madrid’s BME to be echoed on the Pan European MTFs that are located in London (and vice versa). We will call these events where the price on one venue catches up with the EBBO on another venue a ‘re-gain’.
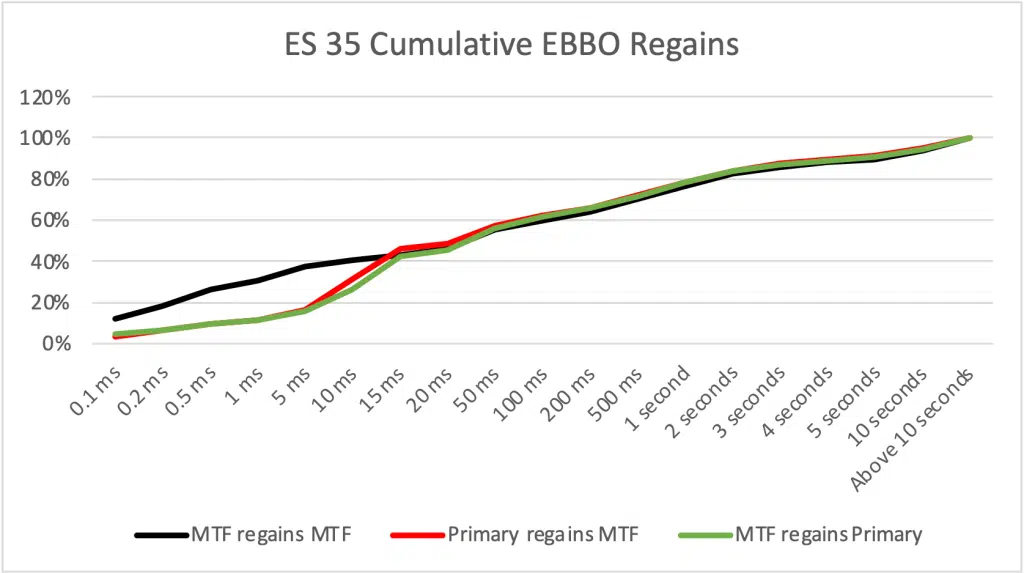
The first chart illustrates the difference in the time taken for regains to take place between Madrid and London, based on a full day’s trading in ES35 names. The graph shows the cumulative frequency of regains arranged by time bucket. The green line represents the case when the Primary market (BME) exclusively sets a new EBBO and the MTFs then catch-up. The red line represents the case when the MTFs set a new EBBO and the Primary catches up, and the black line represents the case when an MTF sets a new EBBO and the other MTFs catch up. Looking at the green line, we can see that 40% of regains by the MTFs take place within 10 to 15 milliseconds of a new EBBO being set exclusively on BME.

We can also see from the black line that regains take place much more quickly between the MTFs, reaching the 40% mark between 5 and 10 milliseconds (probably because they are all located in one place), and finally we see from the red line that the BME regains the EBBO at very close to the same pace as the MTFs regain the EBBO follow a price change on the BME.
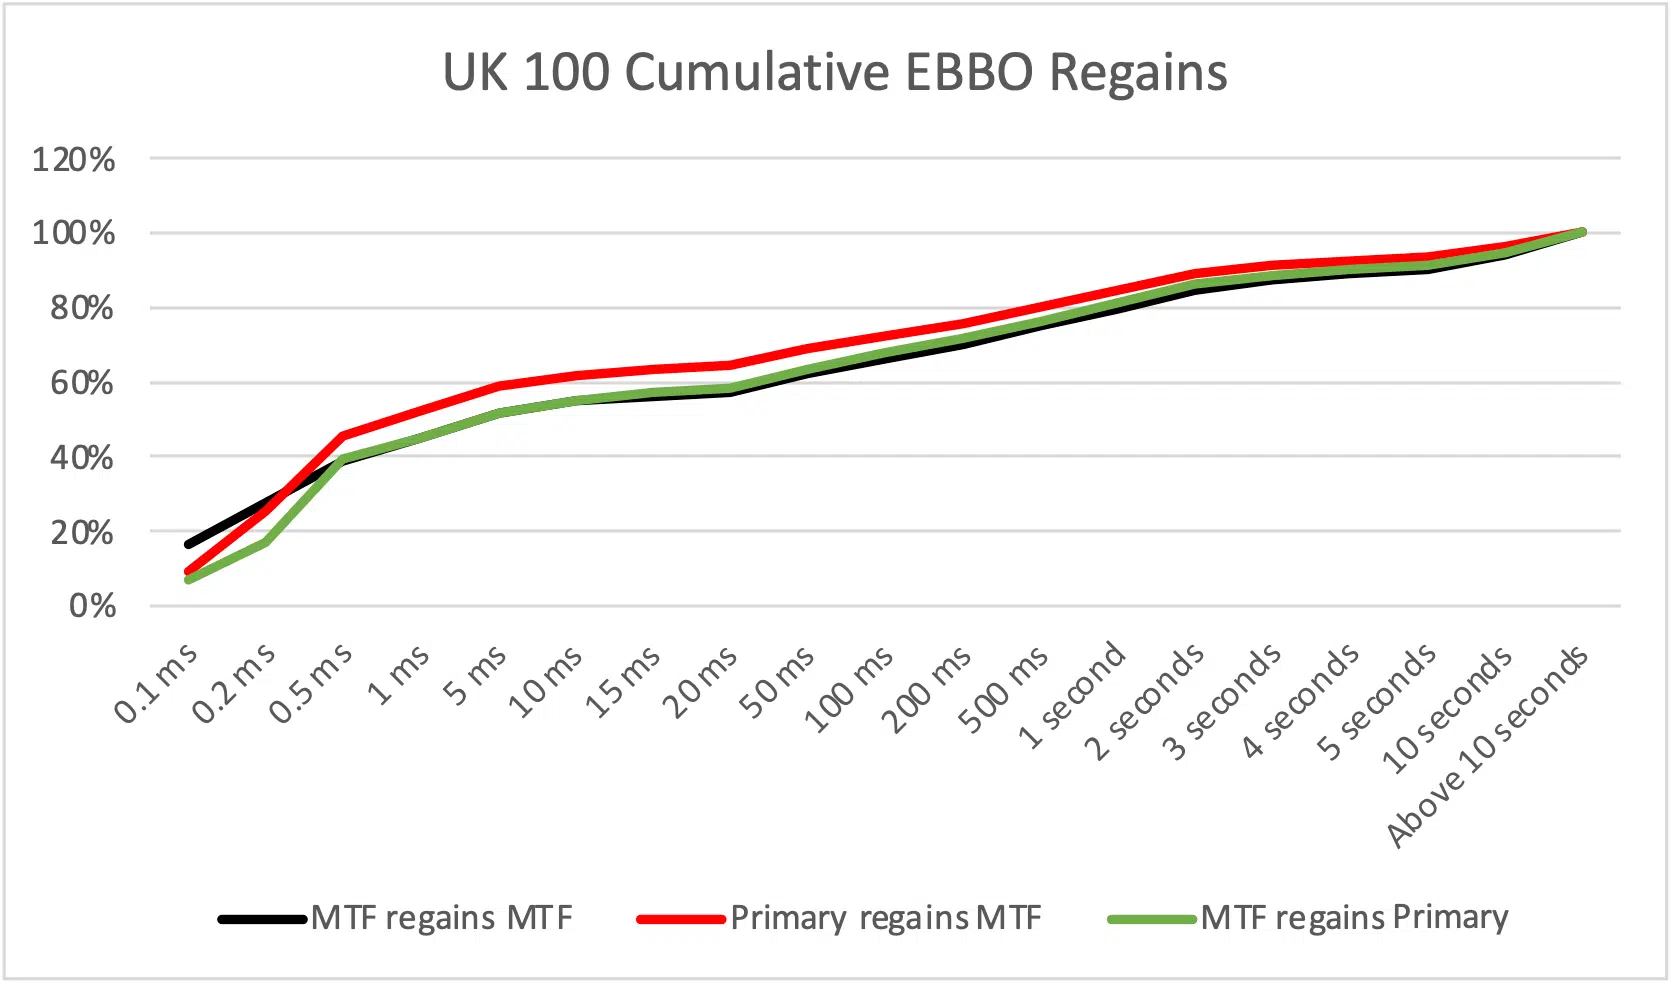
In the second chart, we compare the effect with the UK 100. There is far little difference between the three cases than with the BME data, and 40% of regains take place more quickly, i.e within 0.5 milliseconds, reflecting that the venues are local to each other.
This is a complex subject and there are many things to say about how latency statistics can indicate market behaviour. For example, how is it that around 3% of MTF regains can take place in just 0.1 milliseconds when a new EBBO is set in Madrid when it takes light four milliseconds to make a one way journey? This points to the occasions when one or more participants set out to change prices on more than one venue simultaneously. We can also see that around 20% of regains take place after a second and this is roughly consistent for both BME and LSE names. Perhaps this reflects the occasions where the market needs a while to think about a new price level before reacting.
Understanding the microstructure at this level of detail is a key input to high quality trading algorithms and smart order routers for both passive and aggressive orders. This is why we capture time stamps at the most granular levels available in order to make sense of the data.
We’d love to carry on with this fascinating topic, but there is much to do before Christmas. If you do hear a loud “ho-ho-ho” in the wee hours of Saturday morning, it’s probably because Saint Nicholas has just captured the spread.
****
All the content here has been generated by big xyt’s Liquidity Cockpit dashboards or API.
For existing clients – Log in to the Liquidity Cockpit.
For everyone else – Please use this link to register your interest in the Liquidity Cockpit.
Oh and one last thing: We’ve been nominated in the A-Team’s TradingTech Insight Awards Europe 2022, in the Best Transaction Cost Analysis (TCA) Tool and the Best Trading Analytics Platform categories. Please vote for us here.


