by Richard Hills, big xyt
Day 7 – Business As Usual ?
Update:
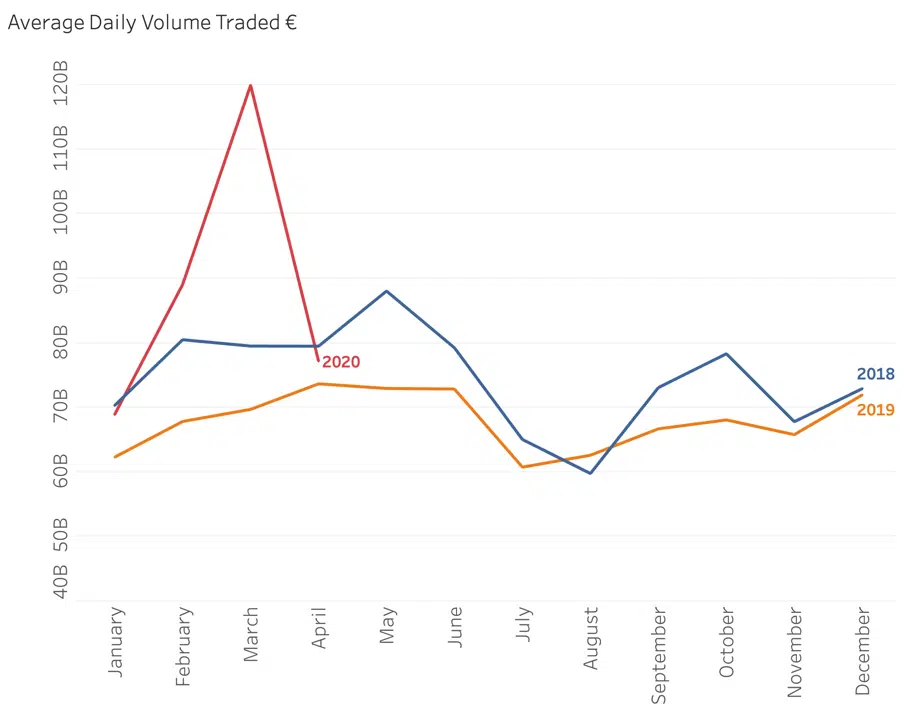
Following a bumper month for European Equity trading volumes during the Great Sell Off it seems that we may be reverting to type. Daily traded value broke through the four year record high of 148 B€ on no less than 7 days, peaking at a little under 180 B€. Then the March ADV of 120 B€ fell to just 77 B€ ADV in April, slightly above the average of 73 B€ for the full year of 2018 (67 B€ for 2019).
This rally is based on much lower volumes than the crash, which are rapidly approaching the ever-decreasing long term average. Perhaps investors are not as convinced as prices imply, or maybe there is more cash to come back into the market to sustain its ascent. It would be more comforting to see a rally with some decent volumes behind it. Buyer beware.
Observers of market volume trends will know that 2019 saw a steady decrease of 9.5% in traded value over 2018. The overall economic picture surrounding this crisis tends to point at this stage to lower investment in European Equities and especially in the short term, so perhaps we should not be surprised if investors are delaying their return.
The case demonstrates the value of looking at microstructure data as an important ingredient in making trading decisions. You can see daily volume data, as well as many other important metrics such as spreads and book depth to identify patterns both at index and stock levels by visiting our Liquidity Cockpit.
Do you want to receive future updates directly via email? Use the following form to subscribe.
On our x Days of Isolation
During these unprecedented times we do not underestimate the professional and personal challenges that everyone is facing. There are far more important things to be doing in the community than looking at a screen.
However, data and data analytics is playing a critical part in providing solutions to the current global crisis. Furthermore, the markets remain open and whilst they do, the trading community needs to be well informed in order to understand the changing market landscape. As a result, big xyt is receiving an increasing number of requests for observations of changing trends and behaviours in the equity markets. We are excited to have recently expanded our London team to enrich our content and support for clients seeking greater market insights from an independent source. Whilst many adjust to the new experience of working from home we plan to share some of these thoughts, observations and questions in the coming days & weeks.
As ever we welcome feedback as this can shape further contributions from our team and the Liquidity Cockpit our unique window into European equity market structure and market quality.
We hope you enjoy them.
—
This content has been created using the Liquidity Cockpit API.
About the Liquidity Cockpit
At big-xyt we take great pride in providing solutions to the complex challenges of data analysis. Navigating in fragmented markets remains a challenge for all participants. We recognise that the investing community needs and expects continued innovation as the volume of data and related complexity continues to increase.
Our Liquidity Cockpit is now recognised as an essential independent tool for exchanges, Sell-side and increasingly Buy-side market participants. Data quality is a key component, as is a robust process for normalisation so that like-for-like comparisons and trends over time have relevance. However, our clients most value a choice of flexible delivery methods which can be via interactive dashboard or direct access to underlying data and analysis through CSV, API or other appropriate mechanism.
For existing clients – Log in to the Liquidity Cockpit.
For everyone else – Please use this link to register your interest in the Liquidity Cockpit.


