by Richard Hills, big xyt
Day 4 – Pump Up the Volume
Summary
It is not news to anyone that trading volumes have simply exploded this month to record levels. We put some eye watering facts and figures on this in a historical context and look at one surprising finding; the distribution of volumes throughout the trading day has hardly changed at all. Do we detect the cool hand of trading algorithms behind this remarkable observation ? We ask some questions as to why this might be, and reflect on how far we have come with electronic trading.
Article
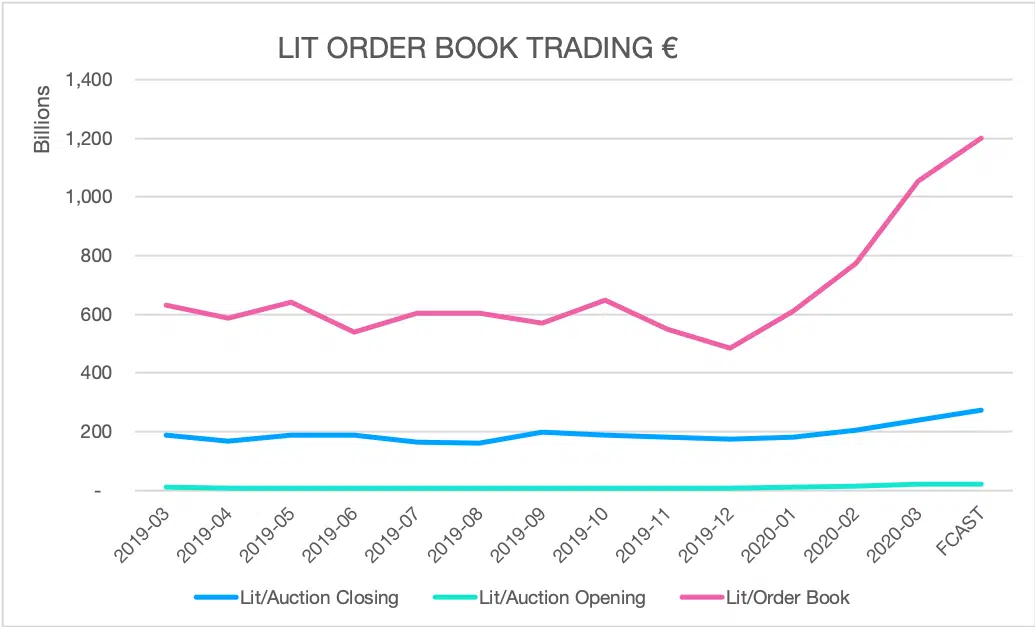
We mentioned earlier in the week that volume was returning to the lit order books from other types of trading venue – such as the end of day auctions. Just taking trades executed electronically on lit markets, we find that volumes increased from an average of 37 B€ per day in the last nine months of 2019 to 68 B€ per day in March, a rise of 93%. Intraday volumes lifted from 26 B€ to 57 B€, (104%) and the Closing auctions jumped from 8 B€ to 12B€ or 52%. Even the unloved Open auctions have increased volumes by 50% to a useful 1.2 B€ per day. Intraday trading on the order books is set to exceed 1.2 T€ in March, 48% higher than the previous record in October 2018.
We noted earlier in the week how the long term increase in Closing auction trading had reversed over the last few months. In March, the market share of the Closing auction fell from 22% in January to 18%, the lowest level since February 2018, despite volumes beating the previous record in June 2018 by 32%. It is highly unlikely that when things get back to normal the trend towards end of day trading will change, but it is interesting to see how large intraday price changes draw volume back into the intraday period. Perhaps this is because of the amplifying effect of increased systematic activities, hedging and market making which account for a large proportion of intraday trading with volume changes moving in lock step with natural, price forming liquidity.

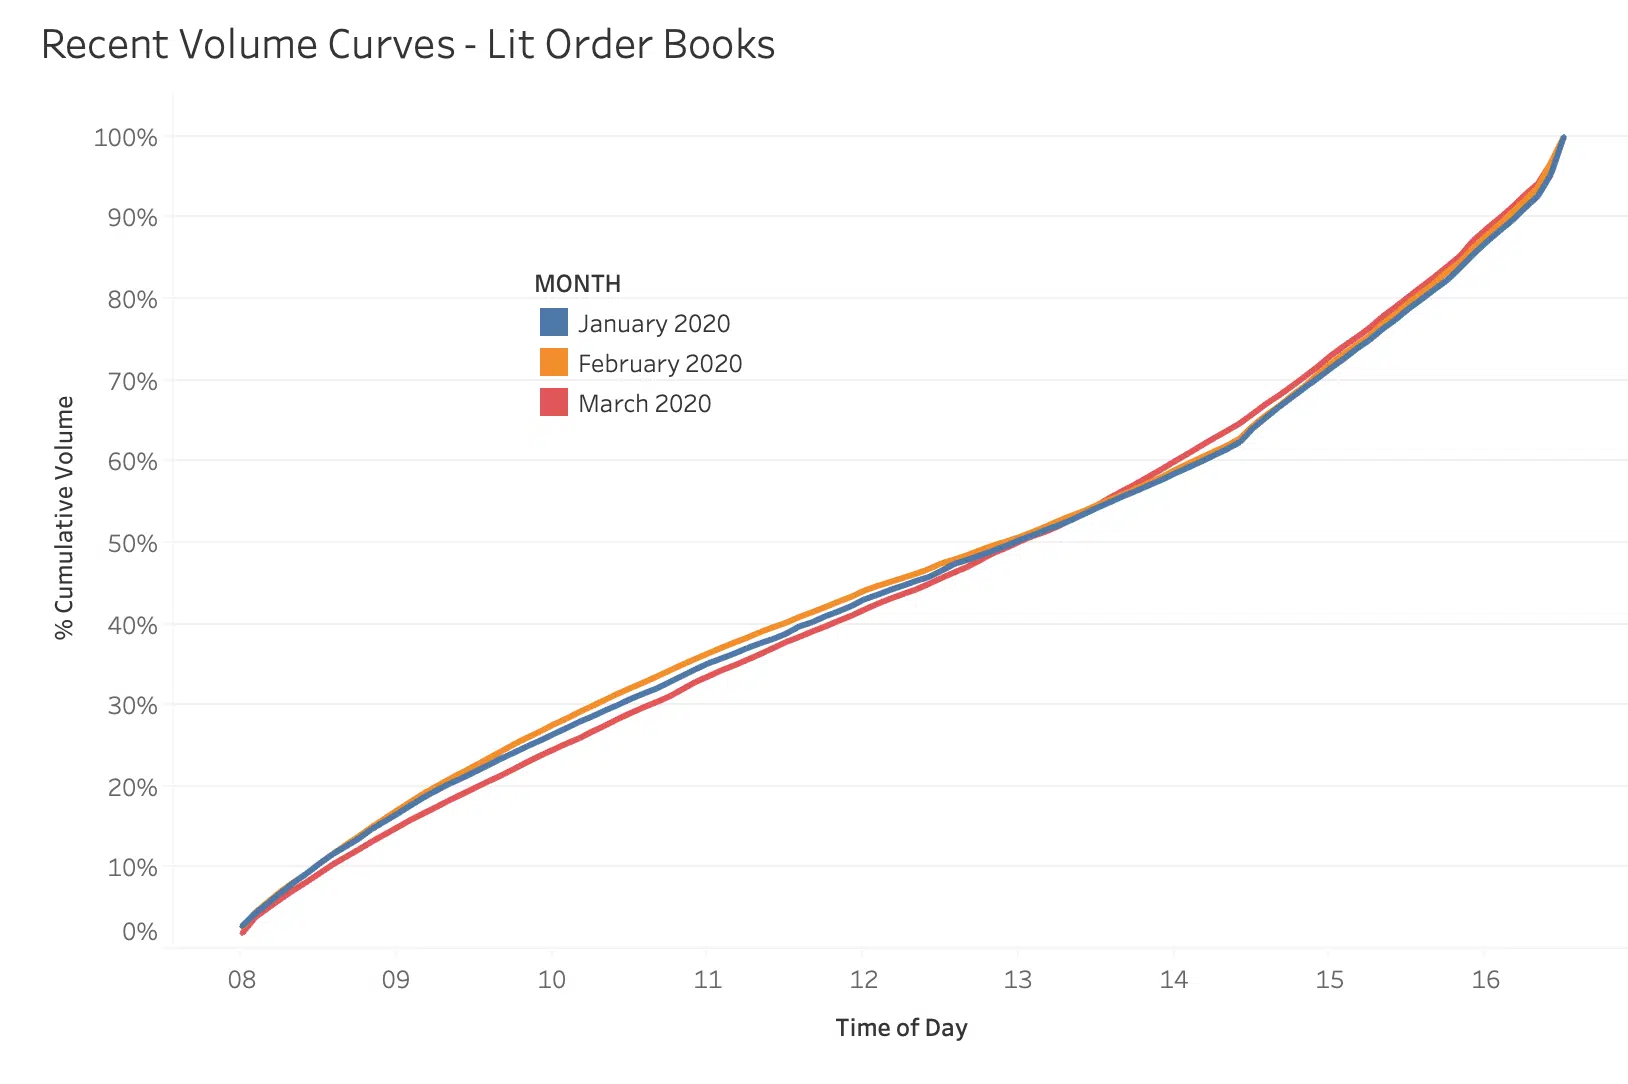
Putting this together we thought we would see a significant drift in the volume curves, and more volume spikes during the day. In recent history, around 40% of the day’s trading has occurred in the last few hours of the day. You can see from the second chart that changes in volume profiles are highly limited, although there is a great deal of variation for individual names. Could this be an indication of just how far we have come as an industry in trading automation ? With so much to trade, it has been a very busy month for trading teams who in general are considerably smaller than in the last crisis, many of whom are now in different sites or in their kitchen. The algorithms have become fundamental to the management of this level of trading, and perhaps even have become crucial to the maintenance of an orderly market. Good algorithms deal with volatility by spreading trades out over time, following a sensible schedule often based on historical patterns, picking opportunities and resisting badly priced liquidity. Perhaps we shouldn’t be surprised that the trading schedules have remained broadly the same.
At big-xyt we can provide daily volume curves for users and algo developers in 12,000 instruments and all significant venues, as well as many other essential trading metrics. If you are interested in letting us do some of the heavy lifting for your algo infrastructure please get in touch.
If you find these pieces of analysis useful, you will find there is a lot more you can do with our Liquidity Cockpit. Clients using our Execution Analysis/TCA are able to measure execution performance with the demonstrated precision and flexibility.
Do you want to receive future updates directly via email? Use the following form to subscribe.
On our x Days of Isolation
During these unprecedented times we do not underestimate the professional and personal challenges that everyone is facing. There are far more important things to be doing in the community than looking at a screen.
However, data and data analytics is playing a critical part in providing solutions to the current global crisis. Furthermore, the markets remain open and whilst they do, the trading community needs to be well informed in order to understand the changing market landscape. As a result, big xyt is receiving an increasing number of requests for observations of changing trends and behaviours in the equity markets. We are excited to have recently expanded our London team to enrich our content and support for clients seeking greater market insights from an independent source. Whilst many adjust to the new experience of working from home we plan to share some of these thoughts, observations and questions in the coming days & weeks.
As ever we welcome feedback as this can shape further contributions from our team and the Liquidity Cockpit our unique window into European equity market structure and market quality.
We hope you enjoy them.
—
This content has been created using the Liquidity Cockpit API.
About the Liquidity Cockpit
At big-xyt we take great pride in providing solutions to the complex challenges of data analysis. Navigating in fragmented markets remains a challenge for all participants. We recognise that the investing community needs and expects continued innovation as the volume of data and related complexity continues to increase.
Our Liquidity Cockpit is now recognised as an essential independent tool for exchanges, Sell-side and increasingly Buy-side market participants. Data quality is a key component, as is a robust process for normalisation so that like-for-like comparisons and trends over time have relevance. However, our clients most value a choice of flexible delivery methods which can be via interactive dashboard or direct access to underlying data and analysis through CSV, API or other appropriate mechanism.
For existing clients – Log in to the Liquidity Cockpit.
For everyone else – Please use this link to register your interest in the Liquidity Cockpit.


