by Richard Hills, big xyt
Day 2 – Mind the Gap: Close to Open price movements
SUMMARY
In this article, we look at the difference in price between two major benchmarks, the Previous Close and the Open – the ‘overnight gap’. The equities market is only open for around 8 hours a day 5 days a week, or just under 24% of the time, leaving 16 hours (more at the weekend) for investors to absorb news from around the world and decide what to do next. The market Open can be thought of as a catch up on price formation. By keeping an eye on the volatility of this gap over time, we get a feel for whether the market is stabilising or destabilising and it can be a useful barometer of whether a consensus is forming. At the moment, there is no sign of that happening.
ARTICLE
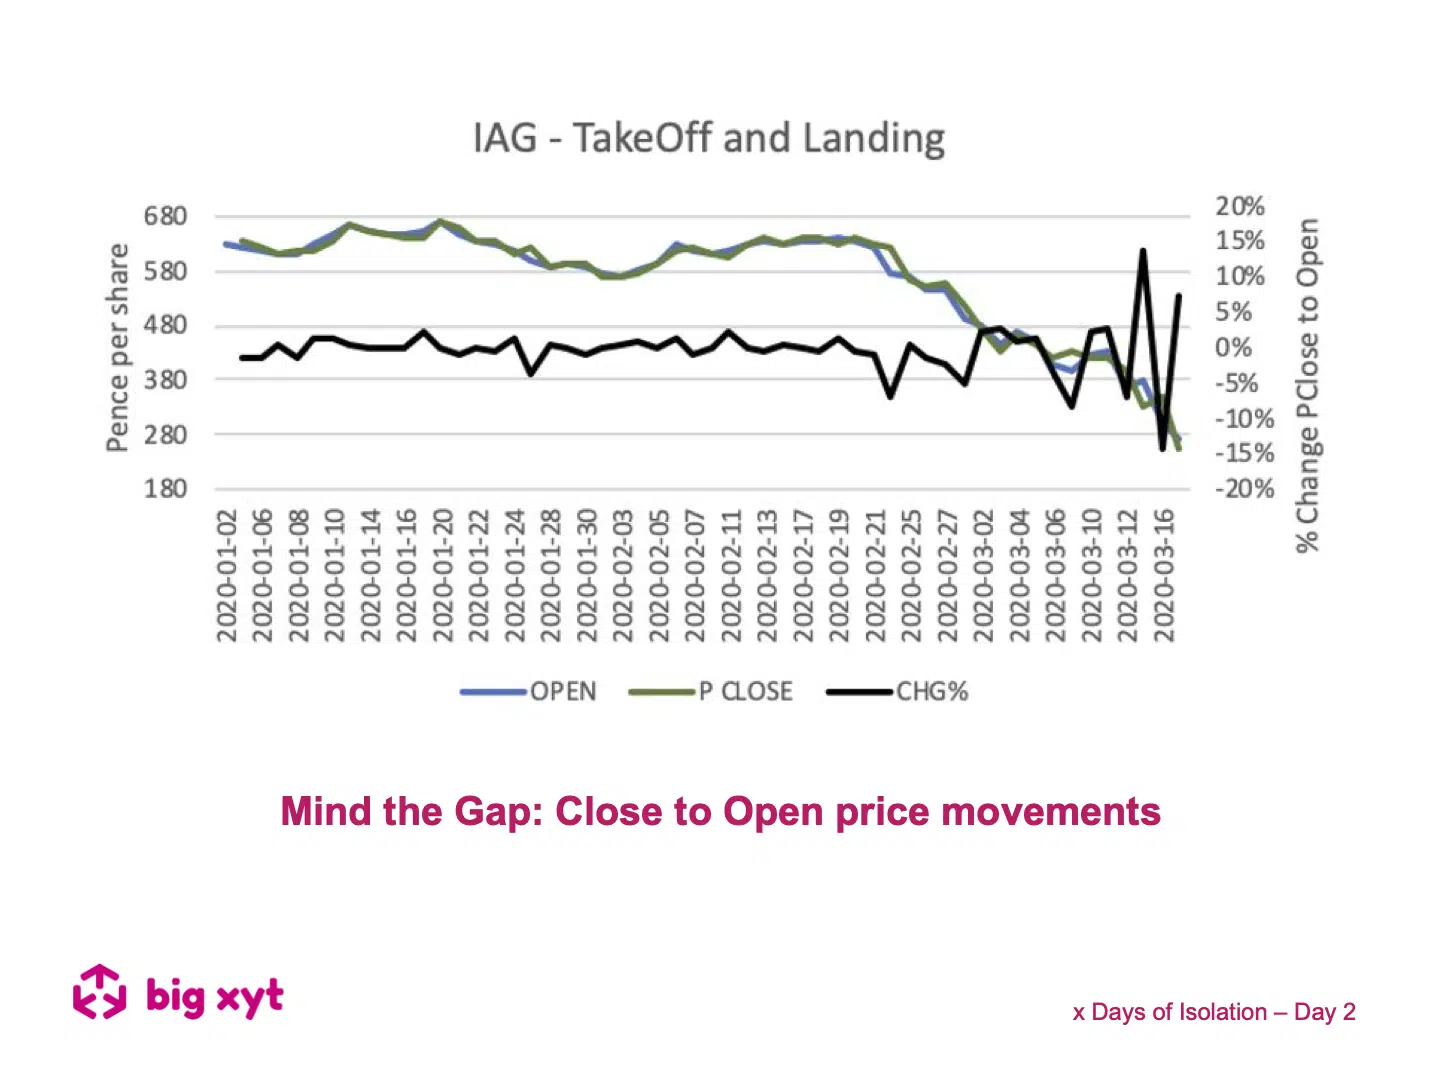
We have looked at the overnight gap between the Close and the Open in European liquid names over the past few weeks, and discovered some alarming data. For the most liquid 600 names, the average price change between the previous close and the open price increased from around 60bps in January/February to nearly 2.5% over the last three weeks. The graph below shows IAG.L, the owner of British Airways and Iberia, and a name at the heart of the travel and tourism storm. The opening price on January 2nd was 629p and now it is trading a little over 210p (it’s been lower), a fall of over 65%. Analyst consensus unanimously agree it is a strong buy with a target price over 450p, reflecting sentiment led sell offs and rallies.
The graph shows the increasing gap between the Previous Close (green line) and Open (blue line) and the % overnight change each day (black line, right scale) as the market becomes more volatile. Look at Friday 13th March. The stock closed the previous night at 334p. It opened 46p higher (13.7%) at 380p, and fell back during the day to close at 350p (7.9%). The following Monday, 16th March, it opened down at 300p (14.4%). This journey between 4 benchmarks was 126p, or 38% of the share’s starting value on Thursday night.
This story repeats throughout the indexes. We already know that any collective scramble to sell or to buy amplifies market impact on prices alongside macro news and fundamental data, creating strong price movements and reversions. But the effect is especially strong when a name is part of an index or several indices, like IAG, and especially when the tracker funds are experiencing heavy sell offs (or buy ins).
For many pension investors with those index trackers, there can be a long delay between instructing the pension provider and the trade being executed – sometimes more than 24 hours. The gap between the price at which the investor decided to sell and the price they eventually received can be substantial, and with current levels of volatility it can represent years of growth. Put another way, this type of volume enters the market based on old information, is certainly at a disadvantage compared to investors with more direct market access who are in a position to trade on up to date information, and will lead to further volatility once completed as prices revert.
While the market is closed, the process of price formation is placed on pause, and there is no mechanism for prices to be updated to reflect new information and for investors to react to it, unless they have access to futures and hedging tools. Given its scale, this is leading to almost daily market shocks on the opening (as well as throughout the day) which look more like fat finger errors. This undermines investors’ confidence and keeps them away from the markets at a time of much needed natural liquidity to support accurate pricing. It indicates that shutting the markets for days or weeks would create even more volatility and uncertainty and could lead to some real drama on re-opening. In Europe, the ongoing debate about shortening the trading day needs to be updated to reflect recent events.
At big-xyt we believe that it has never been more important to use up to date market metrics at the individual stock level as part of the decision making process both in the investment decision and the trading strategy. We will continue to Mind the Gap, but in the meantime please visit our website at www.big-xyt.com to see more.
If you find these pieces of analysis useful, you will find there is a lot more you can do with our Liquidity Cockpit. Clients using our Execution Analysis/TCA are able to measure execution performance with the demonstrated precision and flexibility.
Do you want to receive future updates directly via email? Use the following form to subscribe.
On our x Days of Isolation
During these unprecedented times we do not underestimate the professional and personal challenges that everyone is facing. There are far more important things to be doing in the community than looking at a screen.
However, data and data analytics is playing a critical part in providing solutions to the current global crisis. Furthermore, the markets remain open and whilst they do, the trading community needs to be well informed in order to understand the changing market landscape. As a result, big xyt is receiving an increasing number of requests for observations of changing trends and behaviours in the equity markets. We are excited to have recently expanded our London team to enrich our content and support for clients seeking greater market insights from an independent source. Whilst many adjust to the new experience of working from home we plan to share some of these thoughts, observations and questions in the coming days & weeks.
As ever we welcome feedback as this can shape further contributions from our team and the Liquidity Cockpit our unique window into European equity market structure and market quality.
We hope you enjoy them.
—
This content has been created using the Liquidity Cockpit API.
About the Liquidity Cockpit
At big-xyt we take great pride in providing solutions to the complex challenges of data analysis. Navigating in fragmented markets remains a challenge for all participants. We recognise that the investing community needs and expects continued innovation as the volume of data and related complexity continues to increase.
Our Liquidity Cockpit is now recognised as an essential independent tool for exchanges, Sell-side and increasingly Buy-side market participants. Data quality is a key component, as is a robust process for normalisation so that like-for-like comparisons and trends over time have relevance. However, our clients most value a choice of flexible delivery methods which can be via interactive dashboard or direct access to underlying data and analysis through CSV, API or other appropriate mechanism.
For existing clients – Log in to the Liquidity Cockpit.
For everyone else – Please use this link to register your interest in the Liquidity Cockpit.


