Order placement strategies boil down to some simple questions. Should I cross the spread or rest at the near touch? Do I join the current price at the back of the queue, or should I set a new price, jump the queue and hopefully capture a fill? If only it were that simple.
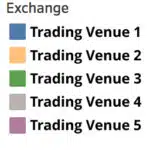
What measures can we use to help solve these puzzles? First, let’s start with the concept of ‘EBBO Presence’, which is the percentage of the trading day that any given venue is displaying EBBO (see Chart 1). This ranges between 60% and 80% for the three venues with the highest ratios. (They don’t sum to 100% because they often show the same prices simultaneously). It is far from a static picture, and notice how during times of volatility, such as in February 2022, EBBO presence fell for all venues, making it harder to capture the best price.
Chart 1: EBBO Presence by Trading Venue: UK 100 (May 2021 – May 2023)
Intuitively, venues with a higher Presence are also likely to be those that are setting, or quickly reflecting the EBBO the most often, and therefore merit our attention when deciding which queue to join or where to make a new price.
The EBBO Presence of a venue can be broken down into the following three main categories (or roles):
- “Active Setter” measures the proportion of time that a trading venue is showing EBBO and was also the venue where that EBBO was first quoted.
- “Active Joiner” is the proportion of time that a trading venue is showing EBBO but was regaining the EBBO set elsewhere by the Active Setter.
- “Passive Setter” is the proportion of time that a trading venue is showing EBBO but where that EBBO was ‘revealed’ owing to a better price being executed or cancelled.
Our second chart below gives the example of the Active Setter ratio. The most recent figures show a range between roughly 10% and 20% for the three venues with the highest ratios. For the Passive Setter ratio, the range is approximately 25% to 35%, and for the Active Joiner ratio, it’s between 35% and 45% (100% being the continuous session).
Chart 2: EBBO Active Setter by Trading Venue UK 100 (May 2021 – May 2023)
From the perspective of an aggressive order (crossing the spread), the venue with the highest Active Setter metric is attractive because that is where the spread is first narrowed. A further related metric is the “Exclusive Presence” which indicates the amount of time that a venue is uniquely showing the EBBO”. A high value for this ratio also implies that the newly created price is sustained, because it is time weighted. Therefore, the metric is equally relevant to a passive trader who wants to be filled.
The final measure to consider is the EBBO Contribution. Shown in Chart 3 below, this is the proportion of shares displayed by a given venue of the overall consolidated touch. At an extreme, a venue could be displaying the EBBO all day, but in only one share. The Contribution metric provides information to check the liquidity of the EBBO.
Chart 3: EBBO Size Contribution by Trading Venue UK 100 (May 2021 – May 2023)
These metrics vary each day, and at the symbol level. They help inform key questions about where and how to place an order. We are now providing these datasets on a daily basis, refreshed overnight and available both through the web dashboards and the API for flexible integration with your smart order routers.
Please get in touch if you would like to discuss these metrics and their meaning further (or if you want to find out which venue is which…).
****
All the content here has been generated by big xyt’s Liquidity Cockpit dashboards or API.
For existing clients – Log in to the Liquidity Cockpit.
For everyone else – Please use this link to register your interest in the Liquidity Cockpit.


