by Richard Hills, big xyt
Spotting volatile liquidity profiles in illiquid names.
Checking liquidity data isn’t just something we need to do once a month using a summary report. It is part of the daily routine. Every stock has its own characteristics that can change significantly and surprisingly frequently, and when you are trading in a fragmented world with so many different types of liquidity pool you need to be alert to those changes to obtain the best execution results.
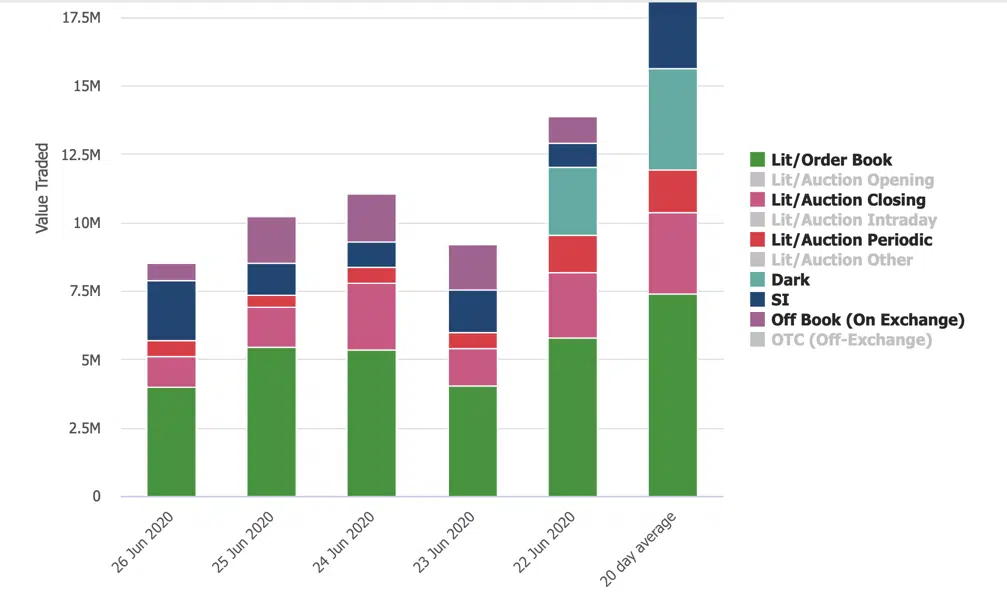
Let’s say you’ve been pushing UK mid caps recently and Travis Perkins (TPK) (purveyors of fine building materials to the trades and DIY) has caught your eye. A new branch has opened in your local area and you’ve noticed a long queue outside at the weekends, not to mention Boris’ now regular speeches about building for the future. Several of your clients like the idea and today a nice order for a day’s ADV has landed on your desk like a 100 litre bag of sharp sand. TPK can be illiquid but you’re keen to deliver an execution that’s as smooth as a final skim. You are tempted to follow your instincts and leave a chunk for the Close while putting a few good size orders into the Conditional venues, but before getting the toolbox out you have a quick look in your big-xyt Liquidity Cockpit.
A few things jump out from the graph shown above that change your mind; TPK has been trading as much as 53% of normal closing value in the periodic auctions over the last 20 days, far in excess of the market average of 13%. On the other hand dark volumes, which were at levels of over 50% of the intraday lit book (the average is 14%) suddenly evapourated to 0% a few days ago. You are immediately alerted to the need to participate in the Periodics and not to expect too much from the Conditional venues, and you adjust the mix accordingly. You also notice some consistent blocks going through off the order book and decide to get cracking with the IOIs.
Although we live in a world of automation and algorithmic trading, we know that clients highly appreciate the human touch – the so called manual overlay. While algos are very good at handling scale, they use models and tactics that incorporate historical data, and here is a real life example of when the historical data doesn’t quite fit current conditions, especially for big trades in illiquid names. The power of visualisation brings complex and fragmented data to the desktop and helps both high touch and low touch traders to quickly reach conclusions about the way to proceed, perhaps with a tweak of the algo, a well placed manual order, or reverting to the good old phone call.
Big XYT’s mission is to provide transparency to a very fragmented market, and we are continuously developing new functionality and visualisations. The attached screenshot was created with our Liquidity Cockpit application through a new view called ‘Single Stock Analytics’. If you would like access, please contact us at [email protected].
If you find this commentary useful, you will find there is a lot more you can do with our Liquidity Cockpit. Clients using our Execution Analysis/TCA are able to measure execution performance with the demonstrated precision and flexibility.
Do you want to receive future updates directly via email? Use the following form to subscribe.
During these unprecedented times we do not underestimate the professional and personal challenges that everyone is facing. There are far more important things to be doing in the community than looking at a screen.
However, data and data analytics is playing a critical part in providing solutions to the current global crisis. Furthermore, the markets remain open and whilst they do, the trading community needs to be well informed in order to understand the changing market landscape. As a result, big xyt is receiving an increasing number of requests for observations of changing trends and behaviours in the equity markets. We are excited to have recently expanded our London team to enrich our content and support for clients seeking greater market insights from an independent source. Whilst many adjust to the new experience of working from home we plan to share some of these thoughts, observations and questions in the coming days & weeks.
As ever we welcome feedback as this can shape further contributions from our team and the Liquidity Cockpit our unique window into European equity market structure and market quality.
We hope you enjoy them.
—
This content has been created using the Liquidity Cockpit API and other analytical tools developed for our clients.
About the Liquidity Cockpit
At big-xyt we take great pride in providing solutions to the complex challenges of data analysis. Navigating in fragmented markets remains a challenge for all participants. We recognise that the investing community needs and expects continued innovation as the volume of data and related complexity continues to increase.
Our Liquidity Cockpit is now recognised as an essential independent tool for exchanges, Sell-side and increasingly Buy-side market participants. Data quality is a key component, as is a robust process for normalisation so that like-for-like comparisons and trends over time have relevance. However, our clients most value a choice of flexible delivery methods which can be via interactive dashboard or direct access to underlying data and analysis through CSV, API or other appropriate mechanism.
For existing clients – Log in to the Liquidity Cockpit.
For everyone else – Please use this link to register your interest in the Liquidity Cockpit.


