By Mark Montgomery, Strategy & Business Development
Mathematics. It’s not complicated, surely? The Ancient Greeks drew lots of models in the sand and we have been developing them ever since. Plus, we’ve built tools to prevent our brains having to work too hard. The evolution of these tools has accelerated from slide rules, to calculators (scientific ones), then computers, followed by Excel and programming languages such as C#, R and Python.
Then along came some new fancy titles like stochastic mathematicians – double the letters so they must be twice as smart.
Which brings us to algo development – buckets of data, lots of models, some really impressive job titles, not to mention huge budgets, and all the algo-charmers need to do is predict the future based on history.
And so with all these tools and letters after their names, plus more history than there has ever been before, these advanced arithmeticians must be well positioned to prognosticate most scenarios in financial markets.
In fact, it’s a piece of cake. Even we, at big xyt, are churning out daily intra-day volume profiles by trading mechanism, by stock, by index, by sector, by any metric one needs really. For the purpose of today’s example we combined primary and MTF volumes to show lit profiles in five minute bins (excluding opening and closing auctions).
Before we consider designing our first algo, shall we look at an example? Barclays’ share price has been sitting at around £1 for about 12 years (or it certainly feels like that long), then suddenly, on Monday it moved up 30%.
First of all, you need an idea on HOW and WHERE it trades.
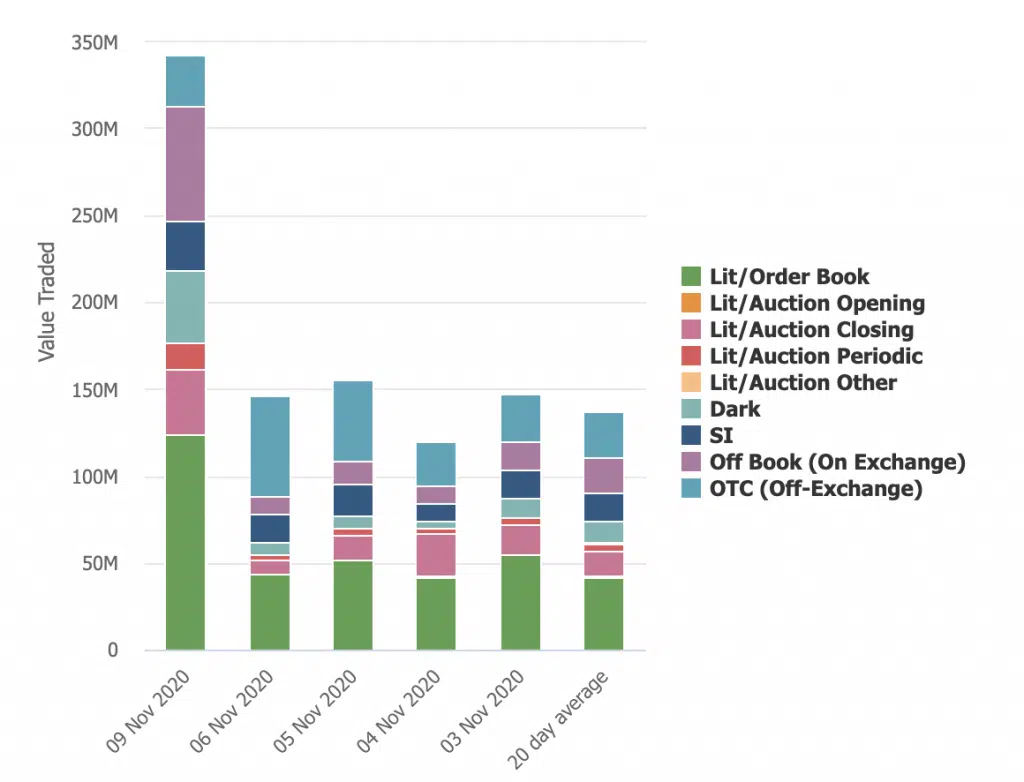
Our first image shows the daily aggregate volume distribution of Barclays shares featuring Monday and going back five days, splitting the turnover between all the available trading mechanisms. And guess what? The fragmentation is different each day with November 9th a long way from the average. A clear view of this picture is reliant upon proper normalisation of the data so that trades in each category and mechanism can be defined and captured accurately.
And secondly, you need to know WHEN it trades. Is there a typical intra-day volume distribution over time?
Market structure experts amongst you will know that most European stocks follow a “smile” during the trading day; busy at the beginning and the end, quiet over lunch (especially in France), with an uptick in activity around the time Wall Street traders wake up to assess the activity in Europe over their double expressos.
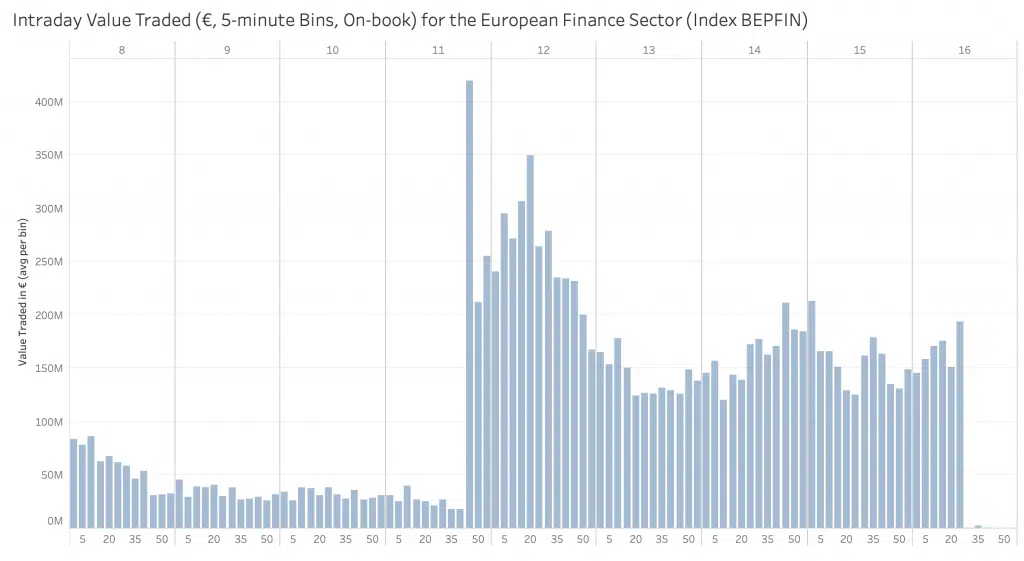
On Monday, at around 11.45am, the rumours about a vaccine turned into news, sending a belated firework through the markets.
Our second chart shows the volume profile on Monday (9th November) of stocks included in an index of European financial companies (BEPFIN). The timing of the announcement, where volumes increased tenfold and the impact on the rest of the day, is clear, almost overshadowing the “normal” influence of the US open. This was no typical day.
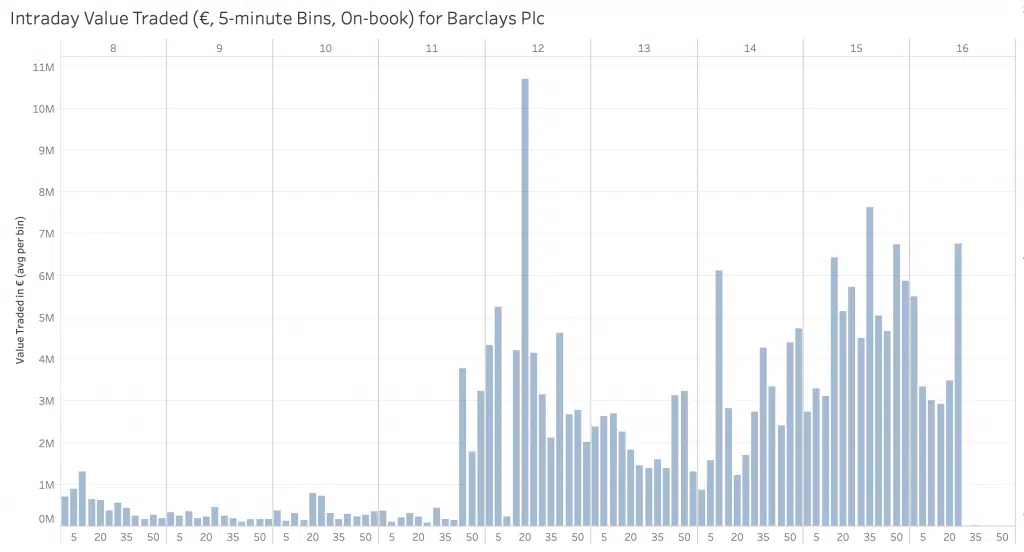
Finally, we return to Barclays, one of the constituent stocks in that index, to examine how similar its own profile was to the sector on the same day.
Once again, the impact of the announcement is clear to see but there are idiosyncrasies, such as a gap in trading shortly after the news as a suspension and intraday auction is triggered by a willingness for buyers to take the price up more than 5%. The huge spike that followed seems to indicate some “catch up” trading going on before trying to return to some sort of systematic profile.
The price of the stock was not the only volatile measure for the reminder of the day, as volumes (in our five minute bins) gyrated erratically.
On days like Monday I feel for the quants and data scientists. Few, if any, could have foreseen the timing or nature of the welcome announcement of a vaccine, never mind the magnitude of the reaction.
The history and the analytics are available, just ask us. Predicting the future? Well, you need a much bigger-xyt subscription for that.
* The illustrations here were sourced from the big xyt Liquidity Cockpit and API


