By Mark Montgomery, Strategy & Business Development, big xyt
For participants in the European equities markets, the use of smart measures around price movements before and after each trade can help to better inform execution decisions, and therefore optimise and improve execution quality.
By capturing every tick in the market for each stock across all venues, we can see how a share price moves before and after each trade.
In normal circumstances, most liquid stocks can be expected to trade at least once within a five-minute period, certainly it is likely that a movement will occur in the bid or ask and therefore the midpoint.
We can measure either the percentage likelihood of a move within the time period or the magnitude of the price change in basis points at a given interval.
In ideal conditions, with a large number of observations, we would expect the measures to be symmetrical, i.e. the probability of a market move and the price change should be the same within a given time offset before and after the trade.
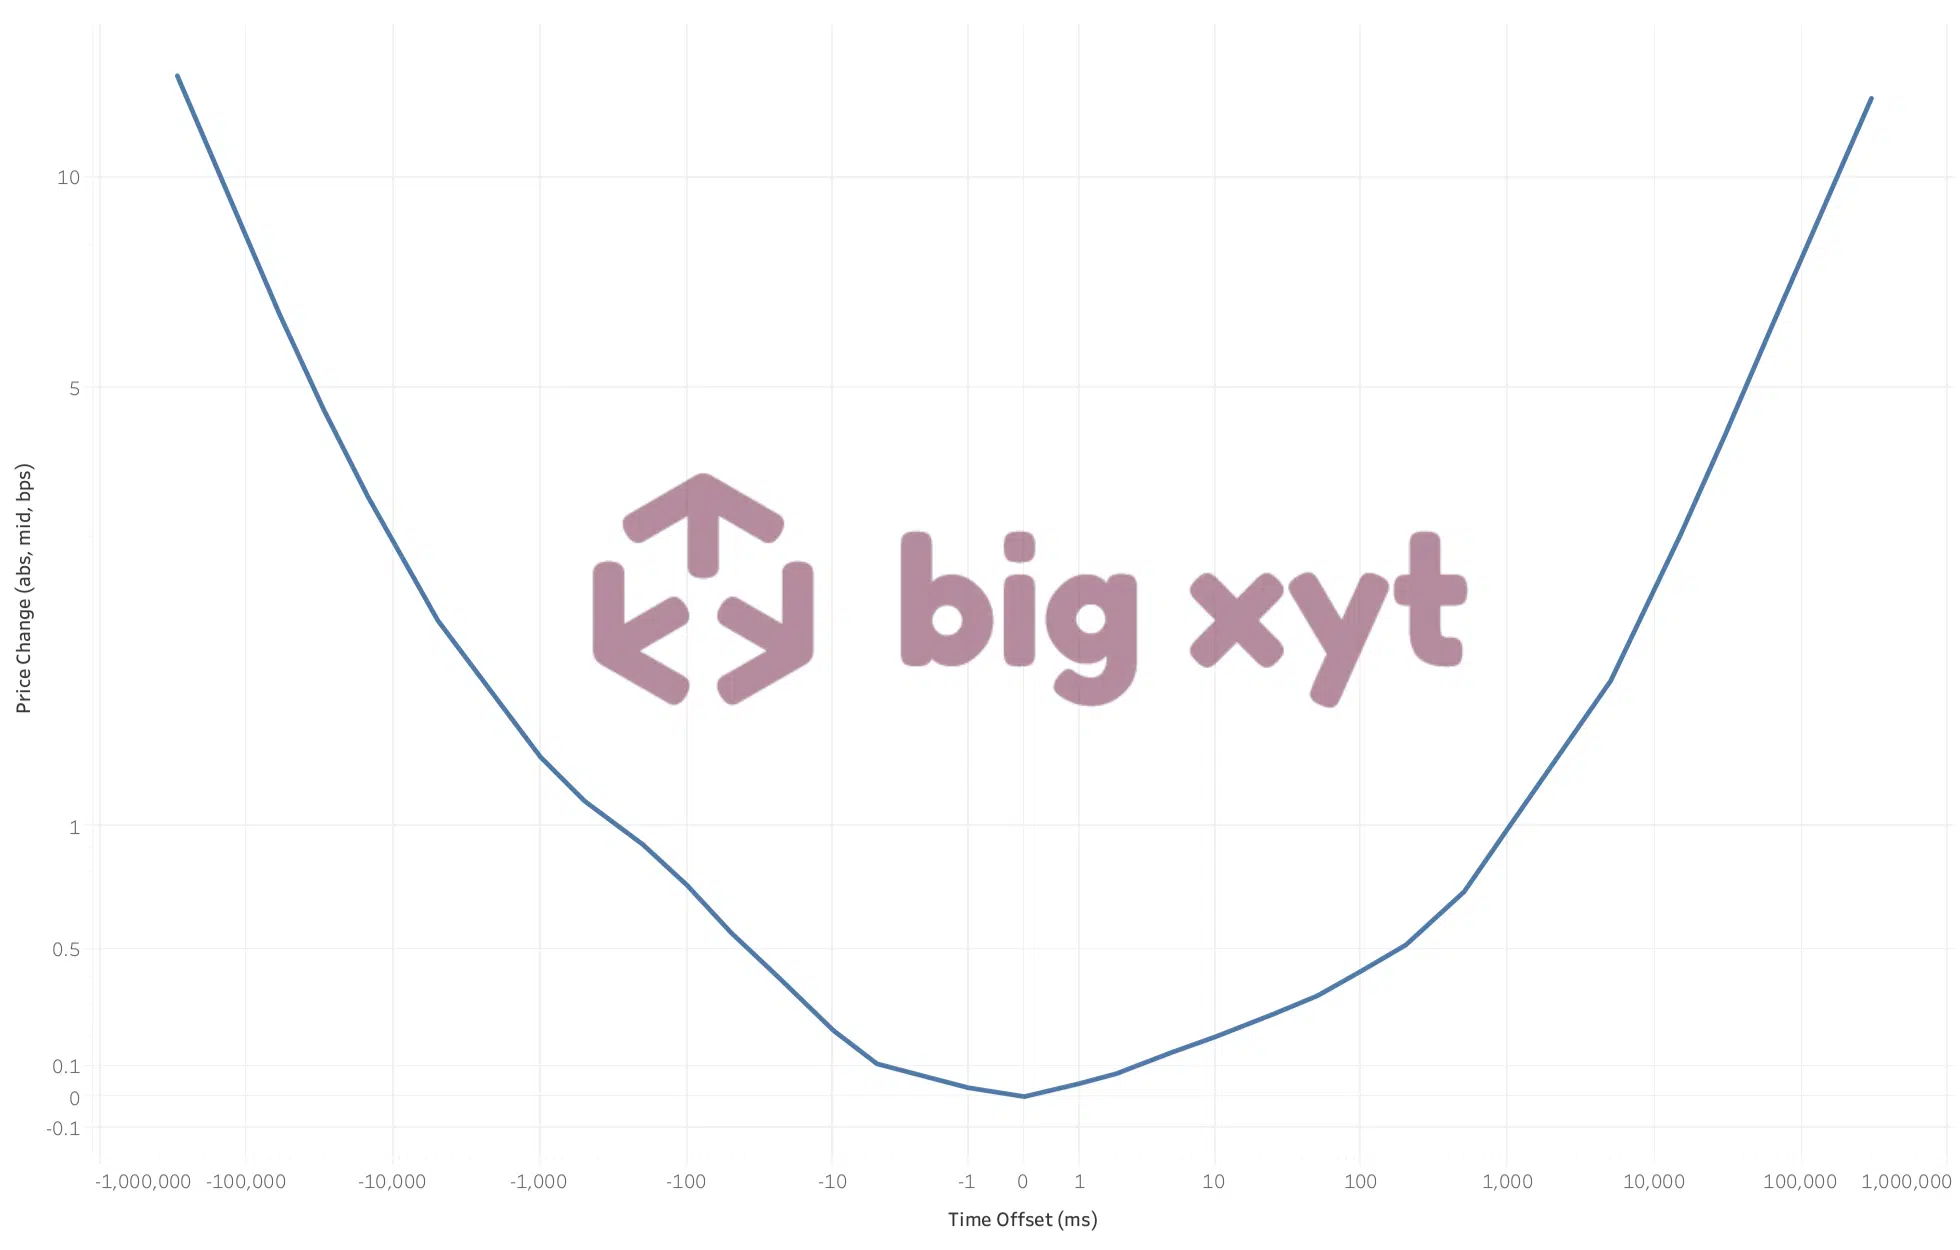
Figure 1: Probability of a market move/price change before and after a sub-Large In Scale Systematic Internaliser trade
A broad symmetrical “smile” on the chart indicates a benign shape with little indication of unexpected movement before or after the trade.
We considered why, in the absence of outside factors, should the curve not be symmetrical either side of the point of execution. A change in steepness or angle may indicate something outside the normal or optimal path.
Central limit order books are the most common and a very transparent execution mechanism. The very nature of interaction on the book results in a mid – point move if the aggressor consumes all of the available liquidity at the touch. This post trade movement resulting from the trade is referred to as market impact. Any evidence of deviation from the norm before the trade would be harder to explain as it may indicate some expectation that a trade is about to take place and could be referred to as “anticipation”.
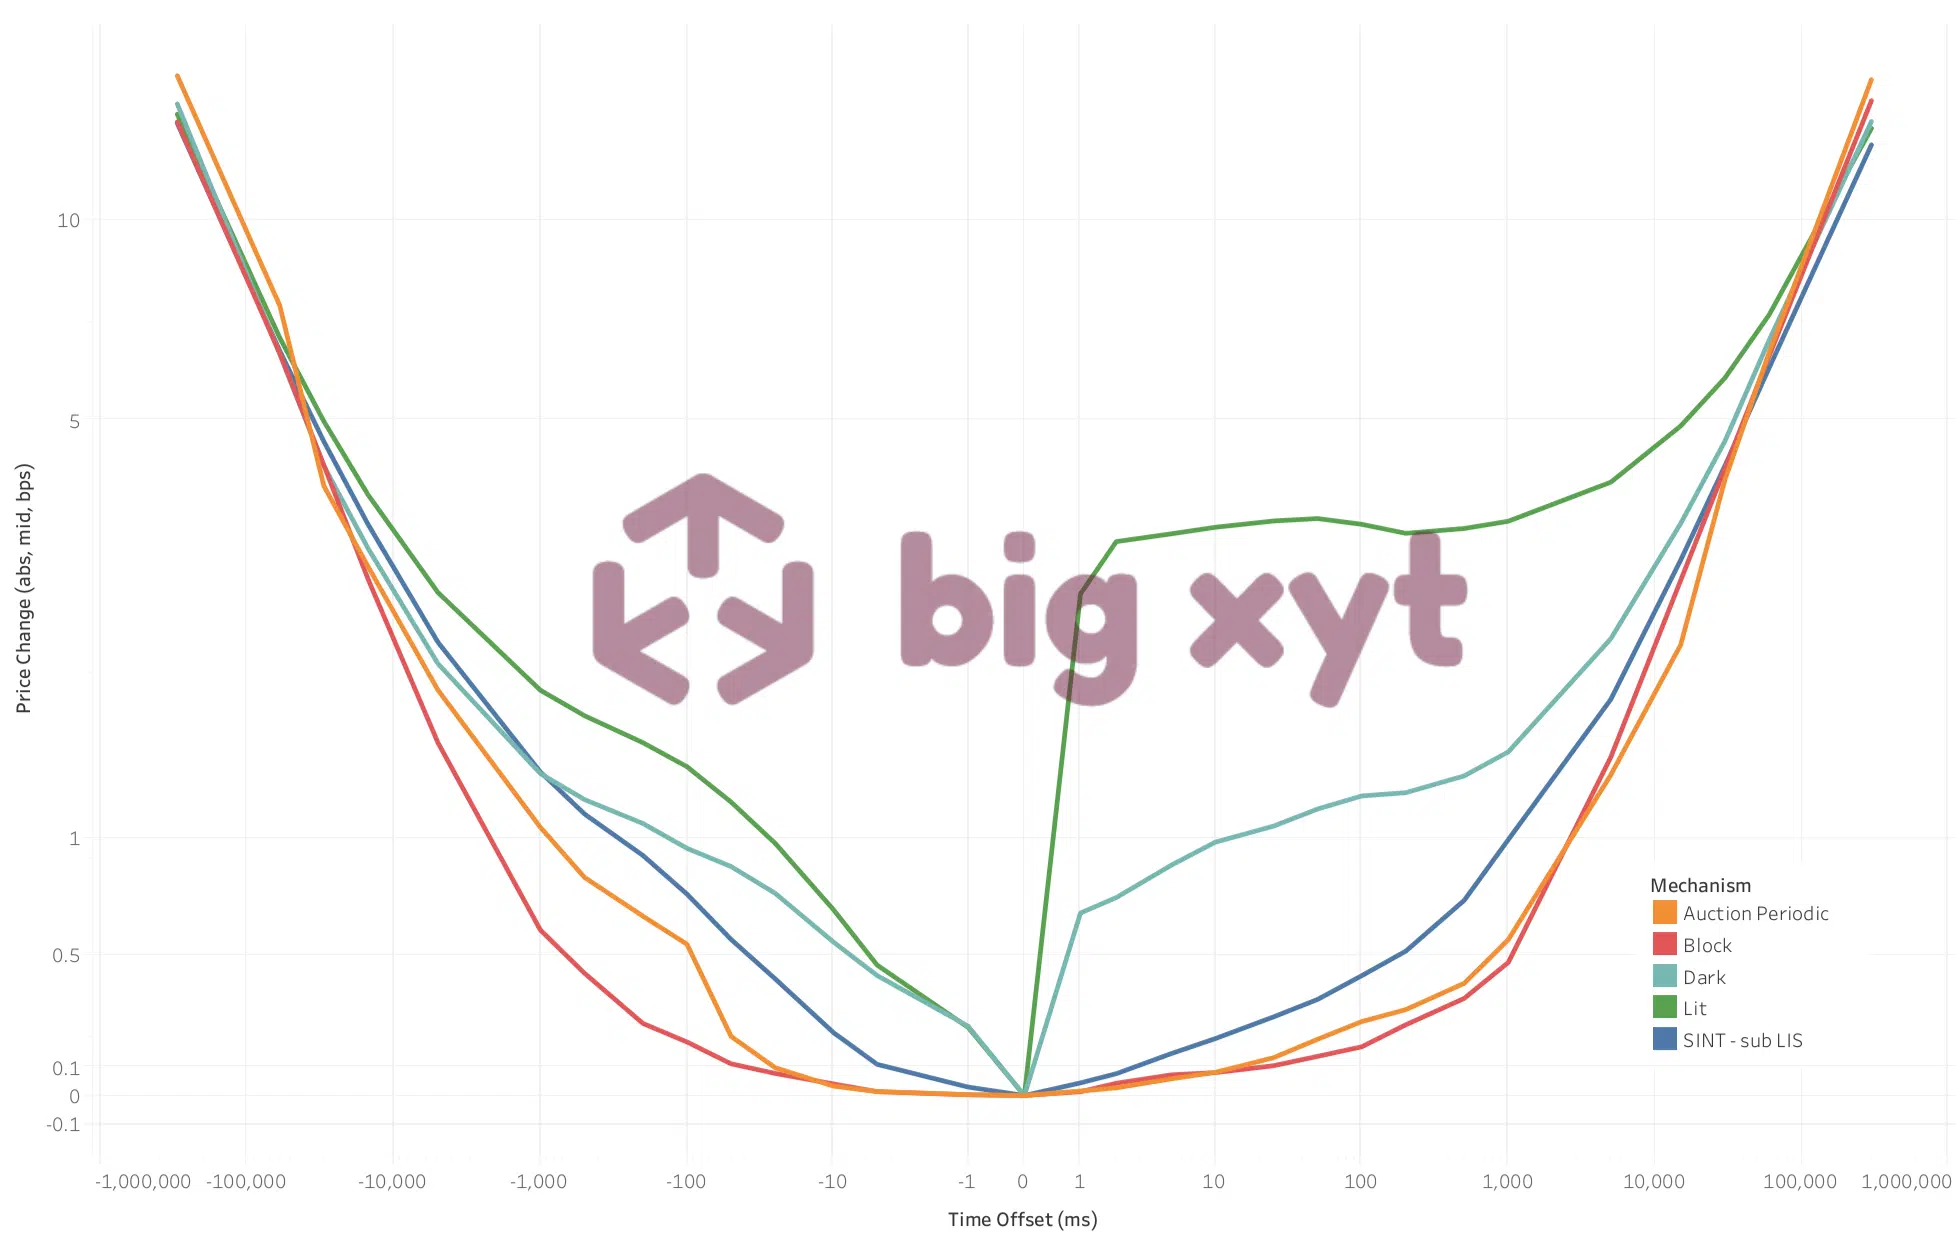
Figure 2: Actual price moves before/after a trade on various types of execution venue
Our measures (and similar publications of the past years) demonstrate that every mechanism shows a different pattern. Some examples:
- Lit markets show a significantly larger post-trade response
- Periodic auctions show a pre-trade response approx. 100ms before the trade
- Block trades seem to be ideal with very low pre-trade and post-trade market changes.
The concept of a symmetrical curve representing a “normal” state for a given set of executions made us look more closely at the results. Could there be a way to aggregate the results in order to more accurately observe the difference between pre and post trade movement and perhaps gain some further insight into different execution mechanisms?
What if we superimposed the pre-trade profile over the post trade? Wouldn’t that show the circumstances where the pre-trade movement was more eccentric than the post trade & vice versa?
Derived from these observations, we developed a new measure that allows the community to easily compare mechanisms and to compare their own transactions against this new benchmark.
The measure is developed as follows:
- The data set must have been cleansed, curated and normalised to ensure that condition codes, time offsets and appropriate filters are consistent throughout.
- For each trade we measure the absolute PBBO mid-price changes in bps with a given offset before and after the trade time (We compared PBBO & EBBO and found the results to be almost identical).
- The offsets are as follows: -300s, -60s, …, -1ms, +1ms, …, +60s, +300s
- Across all trades within a given date range (e.g. a month) we aggregate the results for each offset using a volume-weighted average of the measured price changes (of the mid prices).
- The Price Movement Ratio (PMR) takes the ratio between the post-trade and the pre-trade result for each time offset.
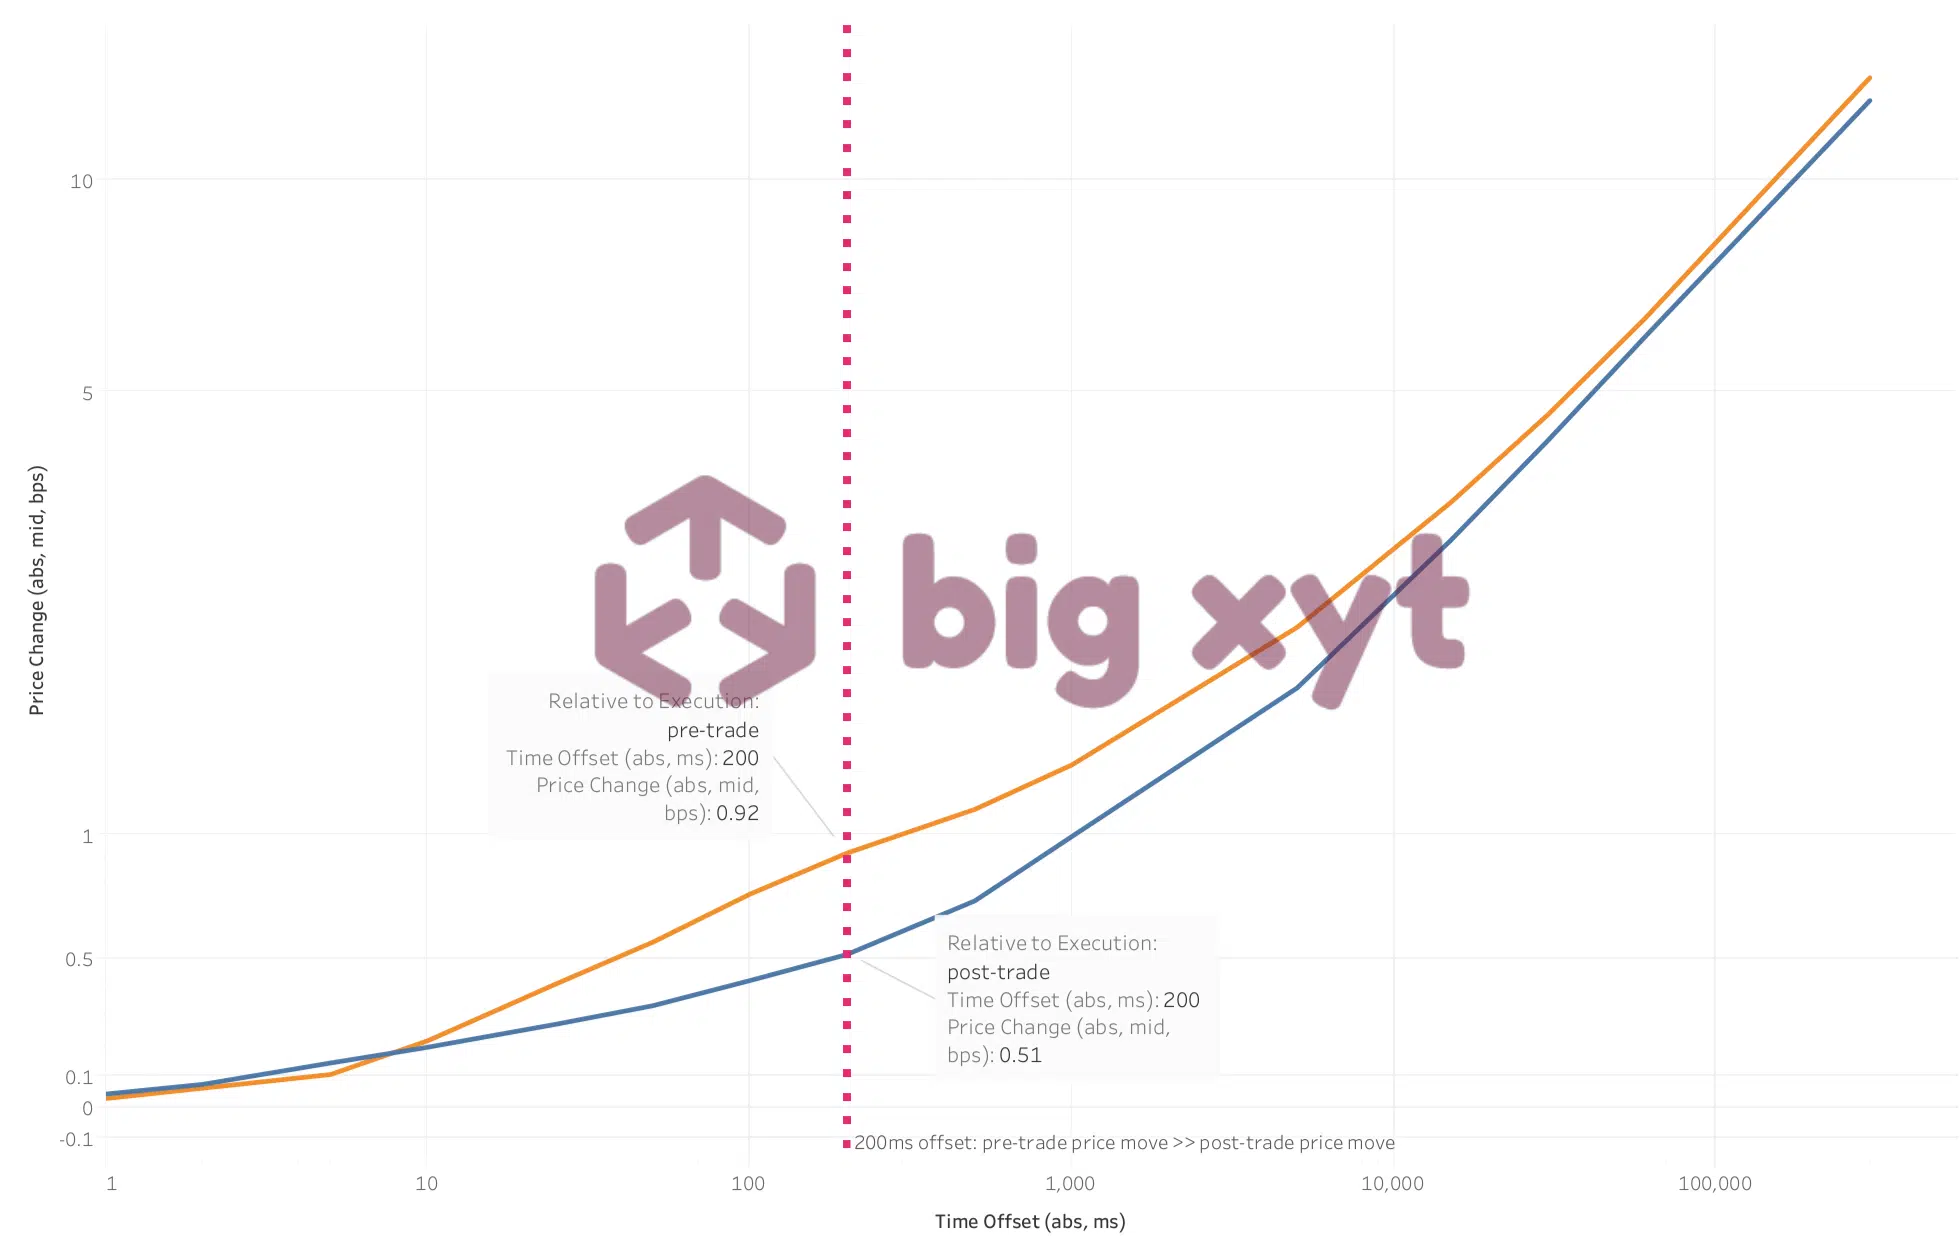
Figure 3: Pre-trade and post-trade mid-price changes (sub-LIS trades)
The Price Movement Ratio shows the following qualities:
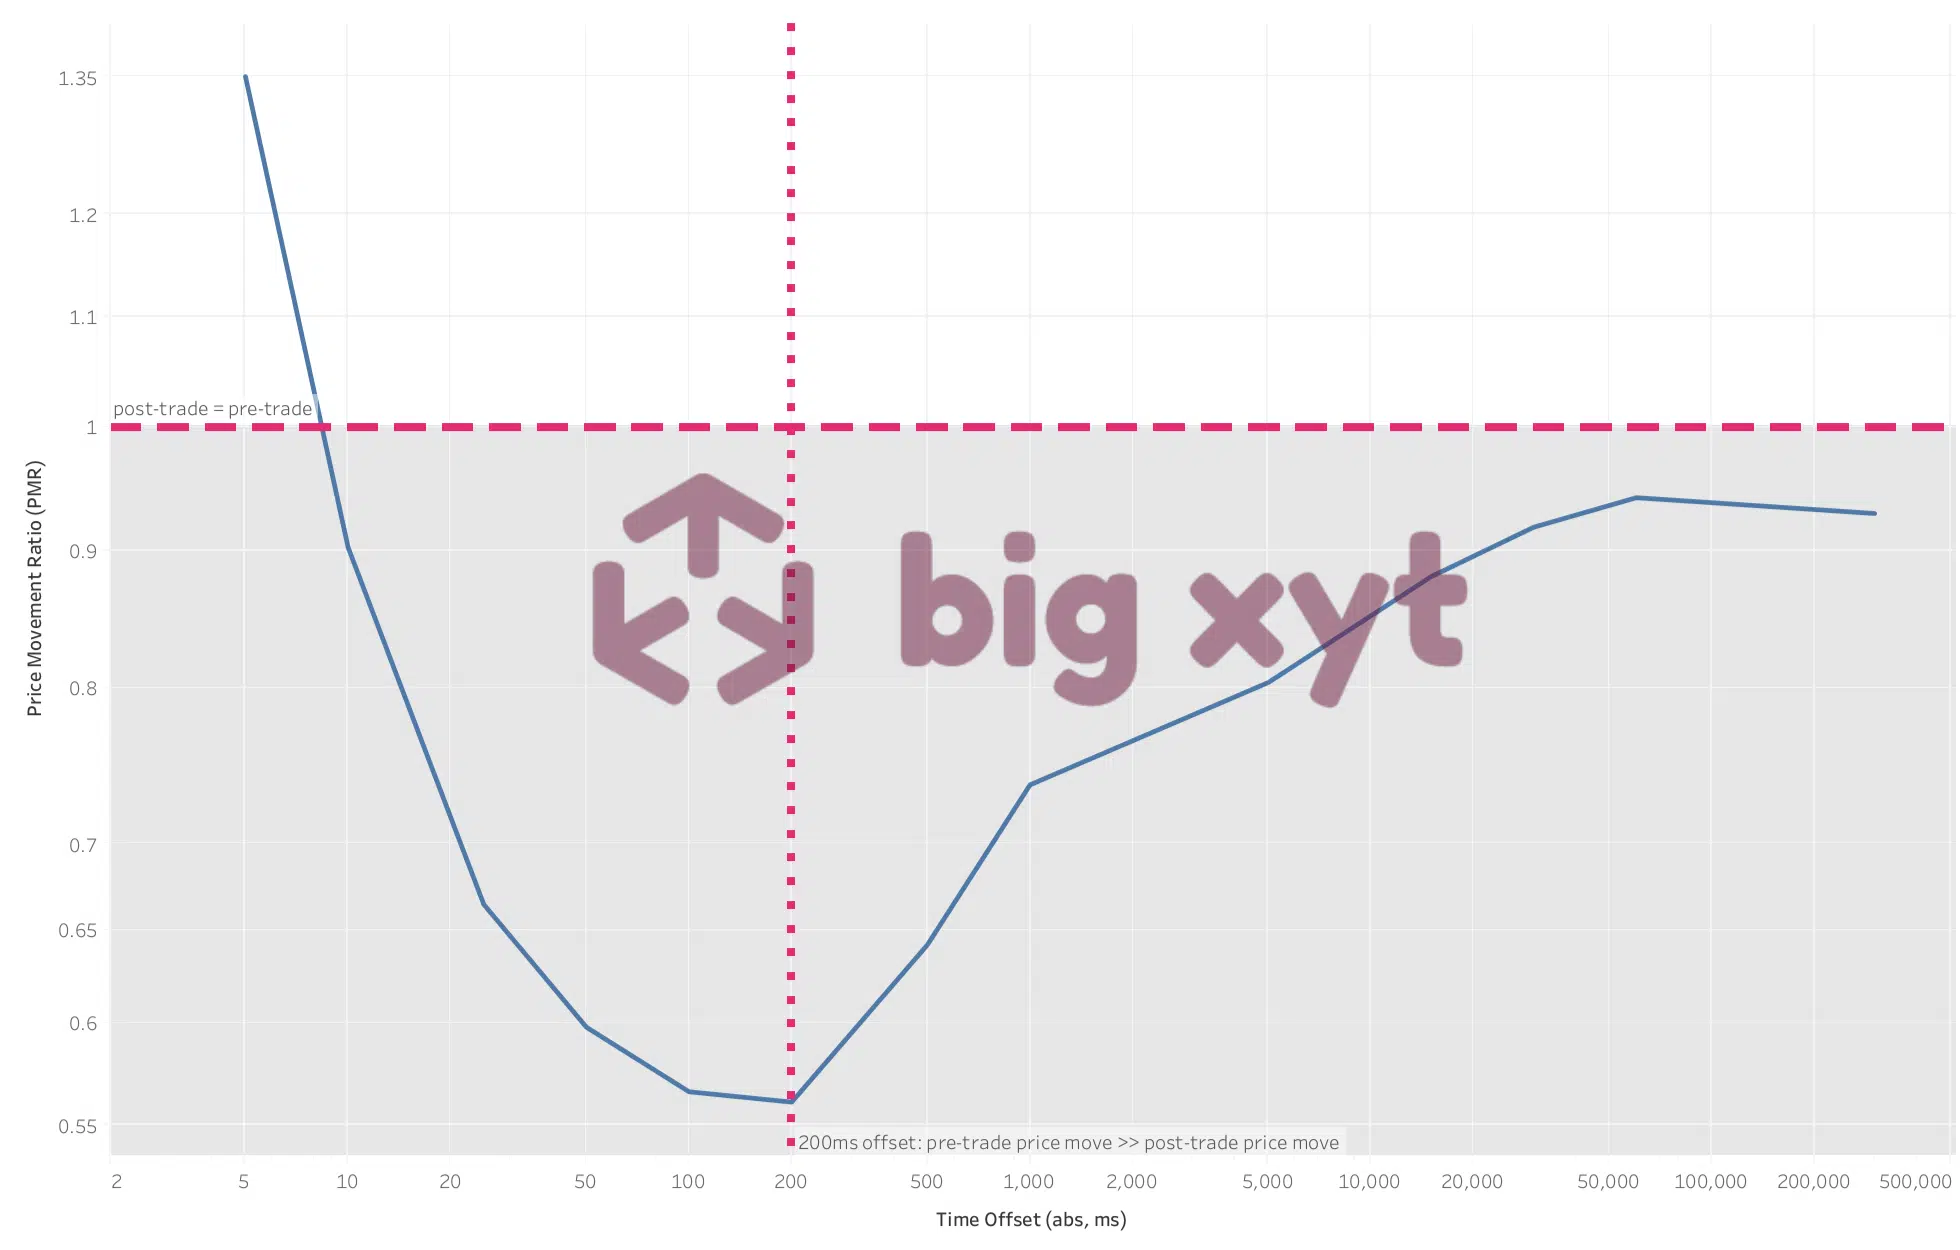
- Ratio value > 1 for an offset T, e.g. 10ms: 10ms after the trade the mid-price change (absolute difference in bps) was larger than the corresponding change measured 10ms before the trade. This could be seen as market impact.
- Ratio value < 1, e.g. at 100ms: 100ms before the trade the mid-price change was larger than after the trade. This could have several explanations relating to the execution mechanism or relate to some “anticipation” that a trade is about to take place.
- Ratio value close to 1: ideal situation, i.e. pre-trade and post-trade behaviour is similar. We can see that the benchmark converges to this ideal state with a growing time offset, i.e. at an offset of 300s the mid-price move before and after the trade is more or less equal (on average).
Example:
Ratio is 0.5 at an offset of 200ms: The average price change 200ms before the trade time was twice as high as the price change observed 200ms after the trade.
Figure 4: Using Price Movement Ratio (PMR) to identify unexpected pre-trade price changes
Using this Price Movement Ratio (PMR) measure, the community has a way not only to identify impact or anticipation but also the magnitude. This measure can be used to compare different trading mechanisms and further to compare venues competing with a common trading mechanism.
We can extend the views to look across geographies/regions and perhaps most importantly over time to see if trends are evolving.
In conclusion, by using price movement measures, firms trading European equities can gain valuable insight into how, when and where to best execute their trades, and improve their overall execution quality.
The new measure is a tool that can help the community to answer existing and upcoming questions, e.g. compare characteristics of liquidity pools (blocks, Sis, frequent batch auctions) over time or to benchmark their own executions (single broker or multi-broker). Reach out to big xyt for a trial of our execution analytics.
The charts used in this article were selected from a more comprehensive study accessible for subscribers to big-xyt’s Liquidity Cockpit.
For more details on how to access and use big xyt benchmarks, please visit www.big-xyt.com.


