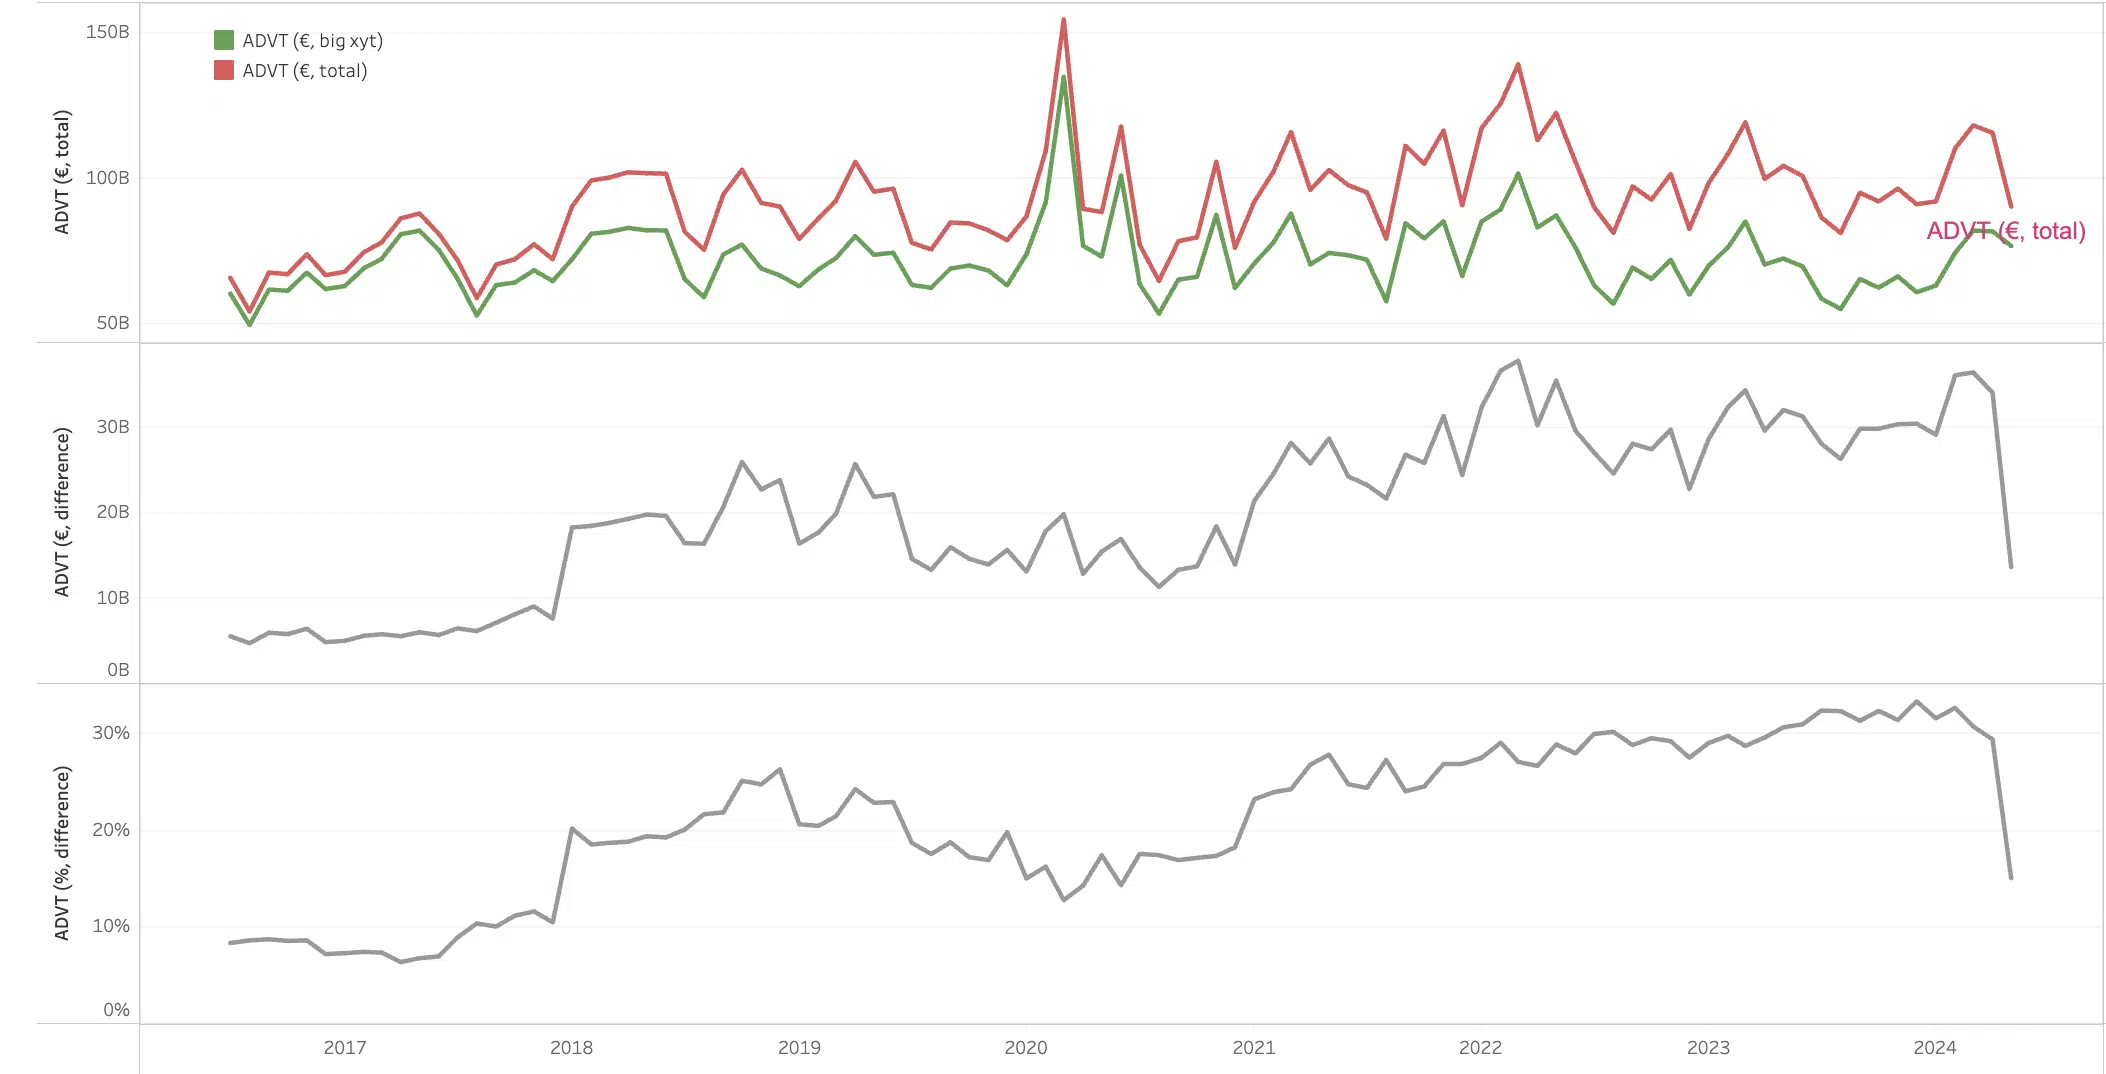
OTC reported equity volumes have been growing steadily since MiFID II. The result was less transparency for a larger portion of the market.
Our measure of non addressable volumes grew from less than 10% of reported pan European equity turnover before 2018 to around 33% in February this year. That leaves a lot of the trading community guessing when one in every three shares reportedly traded is probably not a trade.
Then at the end of April something changed – that unaddressable proportion suddenly more than halved, having fallen to 15% of the total.
What happened and why? Watch this space for more insights…
- The top chart shows total pan European volumes in red with our adjusted volumes in green
- The middle chart shows the difference i.e. total minus the adjusted
- The bottom chart shows the difference as a percentage i.e. a proxy for how much of total reported volume is clearly non addressable.
****
All the content here has been generated by big xyt’s Liquidity Cockpit dashboards or API.
For existing clients – Log in to the Liquidity Cockpit.
For everyone else – Please use this link to register your interest in the Liquidity Cockpit.


