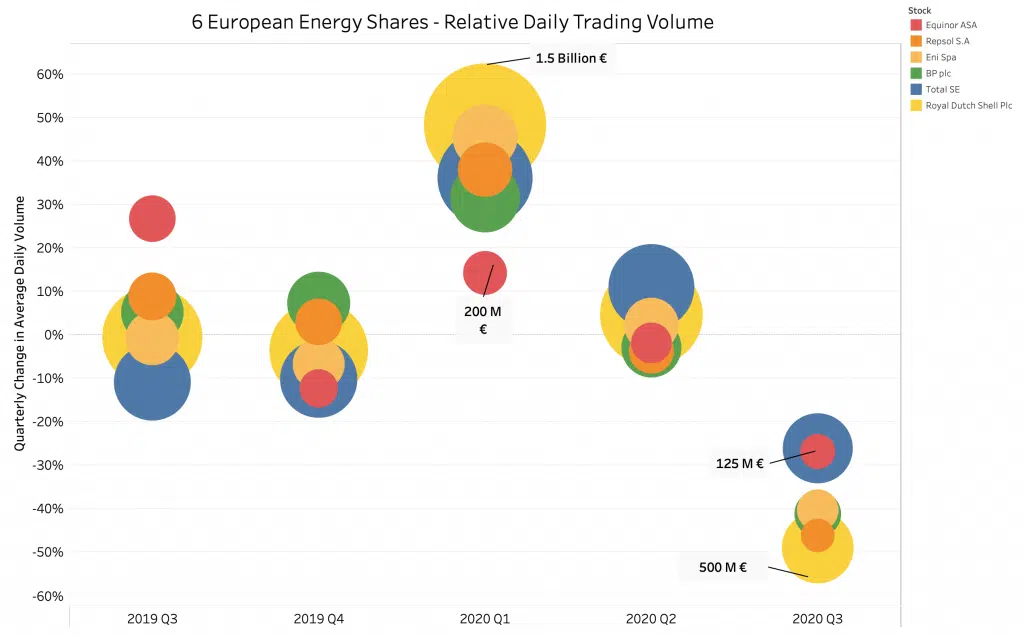
This year, market sentiment has somewhat overwhelmed long-term business strategy and sound financial management, especially in the energy sector. We looked at six energy majors where prices have fallen 39% – 65% from pre-crisis levels. While grappling with the collapse in oil prices, consumer demand and addressing the climate emergency, companies have also had to find the time to reassure their investors.
Market data can provide valuable context to the narrative by drawing direct, quantifiable sector and index parallels. In this example, daily trading volumes have dropped by an average of 57% since Q1, and in a tightly banded range, it shows how the whole sector has been uniformly impacted. Following the heavy rotation out of equities during the great Q1 sell-off, Q3 volumes reached unprecedentedly low levels in these big names (Equinor, Repsol, Eni, BP, Total and Royal Dutch Shell), as seen in most sectors. Reversal of this trend may be a clear signal that recovery is coming.
A good example is Repsol’s recent share buyback programme in early September, designed to increase shareholder value. Where normally this would have supported the share price, the stock was caught up in another general 6% price slide in our basket of six, and in the broader Spanish index during more Covid-related wobbles.
Trading volume is an indicator of liquidity and therefore risk. For active investors, higher risk triggers portfolio adjustment, while lower capitalisation forces passive managers to re-weight their portfolios, thereby reducing turnover in the hardest hit sectors. Meanwhile, short sellers jump in to take advantage. These are typical of the market dynamics which drive prices lower than the expected fair value.
However, there are many other insights that the data helps to reveal for individual shares. For example, in late September and early October both Repsol and Total showed a big increase in off order book block trading versus the other four names, accompanied by greater activity in alternative trading mechanisms such as Dark Pools. In one case, this highlighted a large options exercise that pushed up the day’s volume by over two thirds. These out-of-the-limelight trades are the footprints of large (and normally active) investors shifting their positions according to their longer term view of the shares.
There are many different metrics and comparisons that help to improve visibility for company management to help communication with shareholders and potential investors. But the data is extensive and can be hard to navigate. Understanding the details requires strong analytical and visualisation tools.
The data used here is taken from our Liquidity Cockpit and Single Stock Analytics applications. Please connect with us to find out more.


