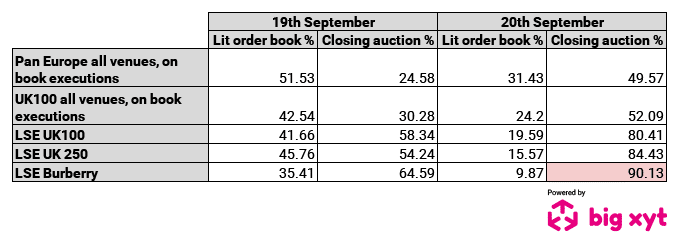
Fragmentation comes in different forms which makes filtering the data an endless source of entertaining insights and relevant information for those who care about this sort of thing.
There was a(nother) big index rebalance last Friday. Looking at all European venues and mechanisms (Lit Continuous, Auctions and Dark), we can see the traded volume shift towards the closing auction during these events.
Looking at UK blue chips it is just as pronounced. Zooming in on the primary market, we begin to see the potential impact on continuous liquidity throughout the day (compared to a single print!).
Looking further down the market cap at UK blue chips, the same applies, maybe more so.
Finally, looking at a feature stock of the day Burberry ………blimey!!
****
All the content here has been generated by big xyt’s Liquidity Cockpit dashboards or API. With the Liquidity Cockpit clients can analyse hundreds of metrics in a convenient and systematic way. If you are interested in learning more about market microstructure, historical and intraday volumes and market quality:
For existing clients – Log in to the Liquidity Cockpit.
For everyone else – Please use this link to register your interest in the Liquidity Cockpit.


