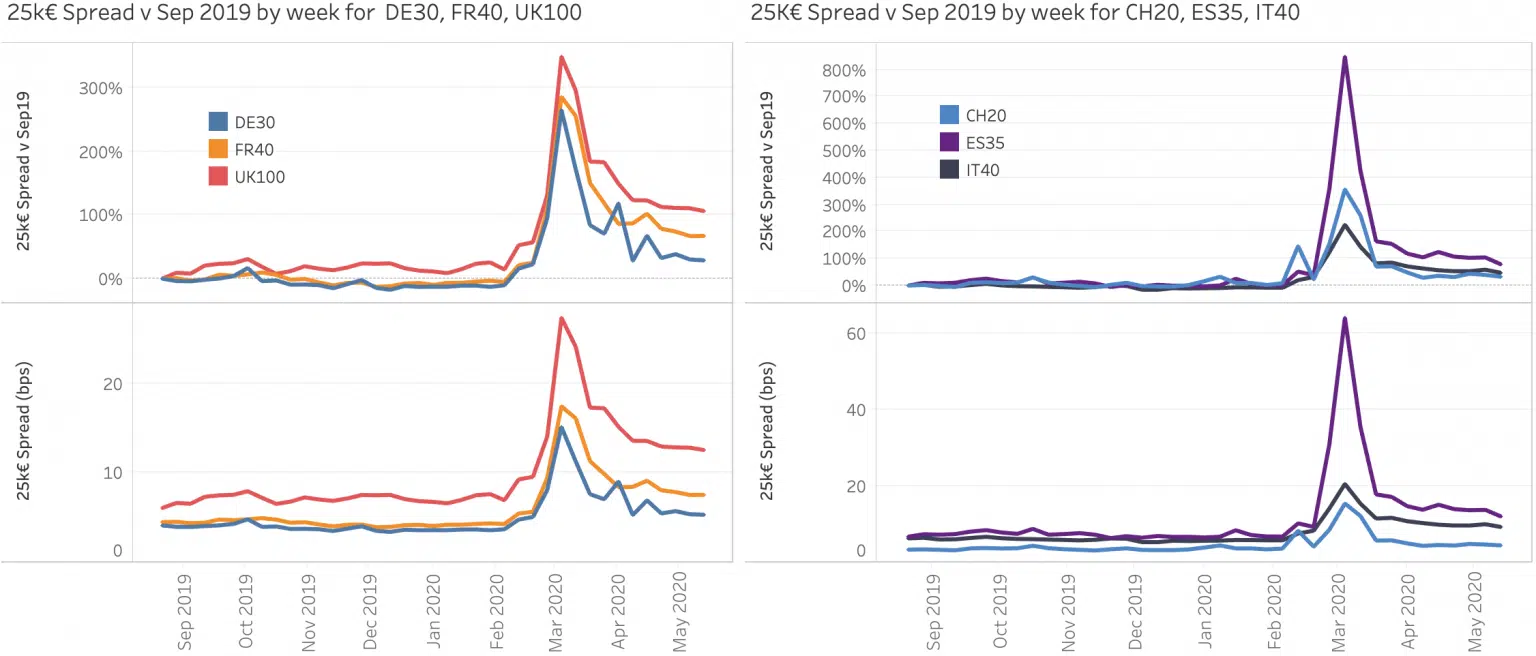
May could almost be described as uneventful in that volumes and market share seem to have reverted to business as usual. A quick look at some market quality metrics tells us that this is far from the case as uncertainty and volatility continue. The chart shows the weekly evolution of spreads since September 2019, both in absolute terms (in bps) and the %change since September for each index. For the most liquid, large cap names in Europe, spreads remain well above their pre crisis levels notably for the UK100.
European Equities Microstructure Survey
Filter by:
Categories
-
In the Media
-
12 Days of Trading 2024
-
12 Days of Trading 2023
-
News
-
Views
-
European Equities Microstructure Survey
-
European Market Structure Microbites
-
12 Days of Trading 2022
-
12 Days of Trading 2021
-
12 Days of Trading 2020
-
12 Days of Trading 2019
-
12 Days of Trading 2018
-
X Days of Isolation
-
Uncategorized
![]()
![]()
© Copyright 2025. All Rights Reserved.