By Mark Montgomery, Head of Strategy and Business Development, big XYT
Over the past five years, the pace of change in the European equities and ETF markets has been almost unparalleled. This in turn is fuelling demand from the buyside community for greater transparency in the form of data and metrics in order to achieve best execution, optimise their trading activities and ultimately make better informed decisions. Yet obtaining the quality of detailed, reliable and completely independent data required to analyse market structure changes has created its own set of additional challenges, not only for the buy-side and sell-side, but also for exchanges, trading venues and even policy makers and regulatory bodies.
For many, the idea of a ‘consolidated tape’ is often the first solution that springs to mind. But would it be the panacea that firms seem to expect?
Not predicting but acting as a guide
In nearly all cases, what firms are actually seeking is twofold: 1) an independent reference of what is happening in the market and 2) the ability to gain meaningful insights from that data. In order to achieve their aims, firms will most likely need to compare a wide range of metrics that go beyond the volume and pricing data provided by a consolidated tape.
More importantly, when it comes to real analysis of how an order or group of orders performed, there’s really only so much that can be learned on trade day (T+0). It is only after the event that you can effectively begin to look at the meaning of the data in the context of trends and anomalies in order to decide whether – over time – you’re achieving your desired results.
Market participants who want more than just the ability to track what is happening on any given day need more sophisticated tools to analyse the necessary range of market metrics for their purpose. To understand whether their orders are behaving in line with expectations, firms need to be able to analyse their trading results against the available venues for that stock, or that index, or that region; in effect, an
alternative peer group analysis, using the rest of the market as a proxy to benchmark their trading performance.
An additional benefit of having a true consolidated view of the available market metrics is that it can be used as a guide for what firms can expect in the future. In advance of trading a particular stock for instance, a user may want to look at a comprehensive historical analysis of volume and time-weighted data, in order to target their executions accordingly. This type of historical analysis can provide a valuable additional layer of pre-trade information.
Reliable and verifiable
The key to all of this is to go beyond the traditional idea of a consolidated tape, by forming a fully comprehensive view of all available data from an extensive range of market sources.
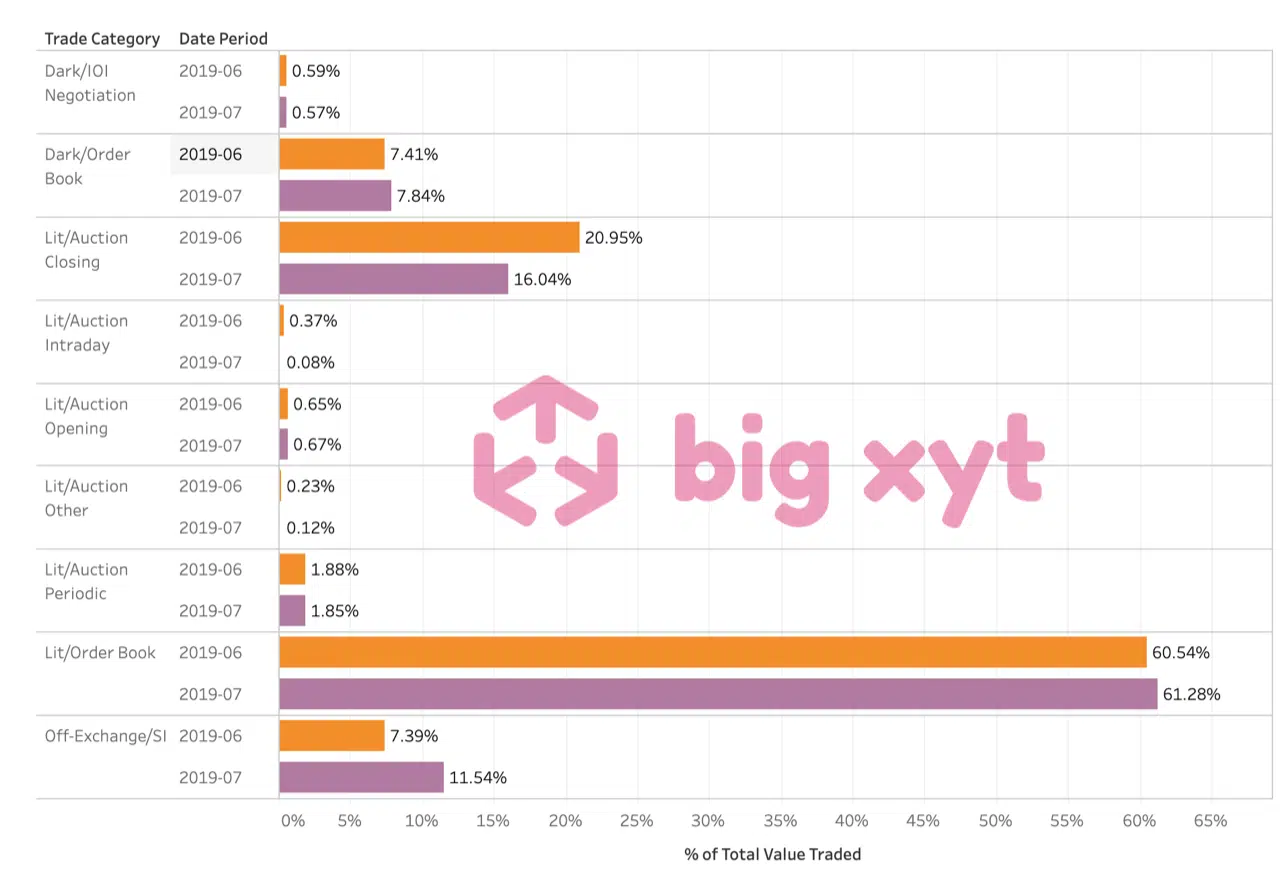
At big xyt, we recently enhanced our 250days GUI to include such data, and to provide users with the ability to filter the information they require, giving them unprecedented levels of transparency and market oversight. Our Consolidated View allows users to analyse and benchmark their performance against an extensive range of validated, independent data covering the primary exchanges, MTFs and other relevant off-exchange volumes. Users can observe changes across not only displayed liquidity, but also dark pools, periodic auctions, systematic internalisers etc, and drill down on the individual metrics they require, such as value traded, market share or spread, for example.
Although the Liquidity Cockpit has been available to our own clients (including leading firms and regulators) for the past two years, we have now taken the decision to go a step further and make the Consolidated View available for free to the whole community. We believe this will further contribute to the efficiency and transparency needed in the European equities markets and will become a valuable evolving tool to help better understand market liquidity and observe changes in market structure in
this dynamic environment.

