
The strange times continue. While Q1 broke all the records, Q2 came up with a few surprises. The biggest MSCI rebalance in history pushed the figures up for May, thanks to some major index re-weightings. Volatility returned in June to create the 3rd biggest month since MiFID2 began. In our quarterly review we look at the patterns of volumes and market share and this time we take a closer look inside the box of Systematic Internalisation.
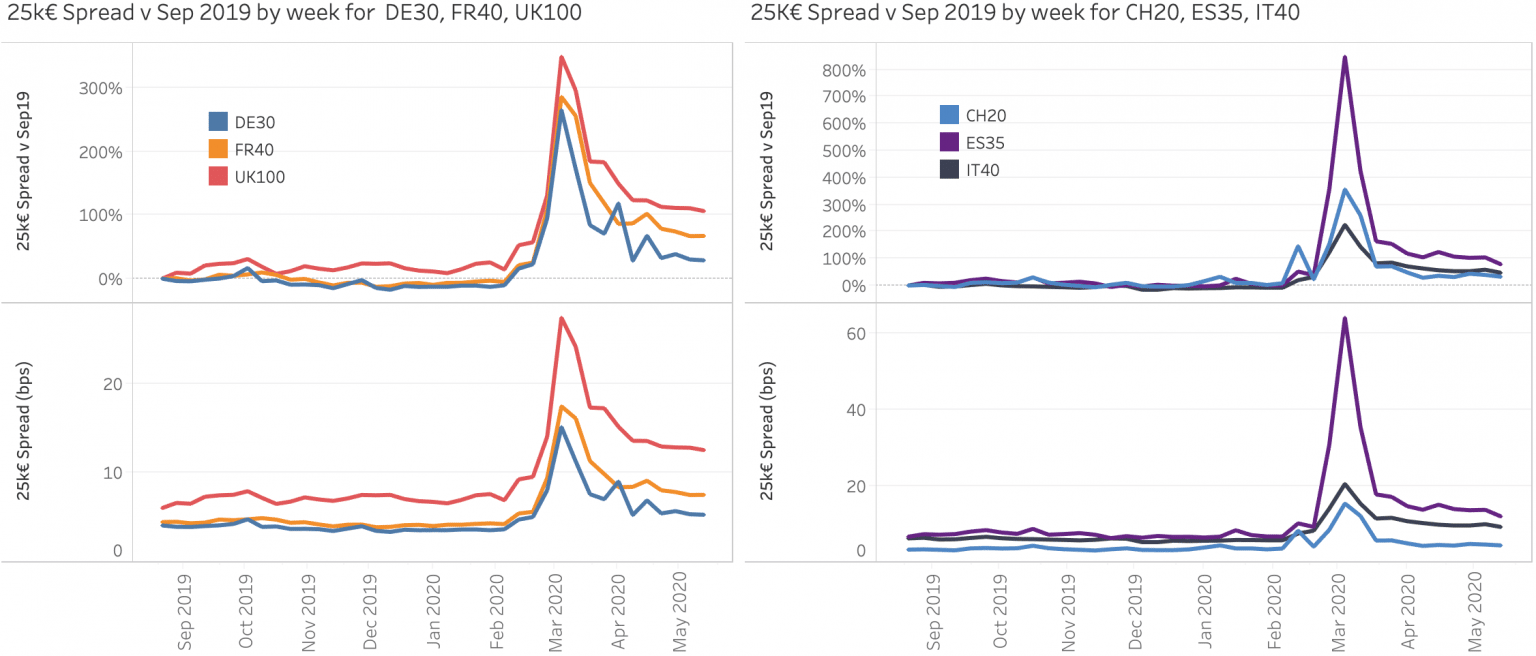
May could almost be described as uneventful in that volumes and market share seem to have reverted to business as usual. A quick look at some market quality metrics tells us that this is far from the case as uncertainty and volatility continue. The chart shows the weekly evolution of spreads since September 2019, both in absolute terms (in bps) and the %change since September for each index. For the most liquid, large cap names in Europe, spreads remain well above their pre crisis levels notably for the UK100.
Recent market volatility has created a domino effect of changing market behaviours as investors struggle to understand changing liquidity patterns. big xyt has received an increasing number of requests from the community for guidance on market quality as the exceptional trading conditions persist. As a result of these enquiries, additional content is being added to the unique Liquidity Cockpit which provides a consolidated view of the European Equity Market landscape.