Tradition has it that there are exactly nine magic reindeer. We assume that these reindeer must at some point have been selected from millions of potential reindeer candidates for the particular characteristics that made them ideally suited to pulling a sleigh carrying thousands of tons of presents at close to the speed of light.
Also note that each reindeer is different. So it must be the blend of those characteristics that makes them so special. Maybe the combination of a reindeer with big horns and another with a shiny nose helps to keep the sleigh moving in a straight line. Maybe nine reindeer is exactly the right number to balance thrust and drag. Who knows?
But given that Santa’s job doesn’t get any easier, he must have to review this particular blend of reindeer on a regular basis to ensure optimal reindeer selection given air traffic conditions and the good:naughty ratio. How on earth does he do this? He must be using Cluster analysis.
To help understand this problem, we can draw parallels with trading, where our primary concern is how to minimise execution cost given current liquidity and price conditions by adjusting tactics such as our trading speed and venue selection. By using post-trade data, we can study all trading properties and assess their relative relevance to a particular share and which combinations are most valuable for predicting a certain trading outcome, such as expected cost. These factors can then be used in the trading process, whether it is high touch or low touch.
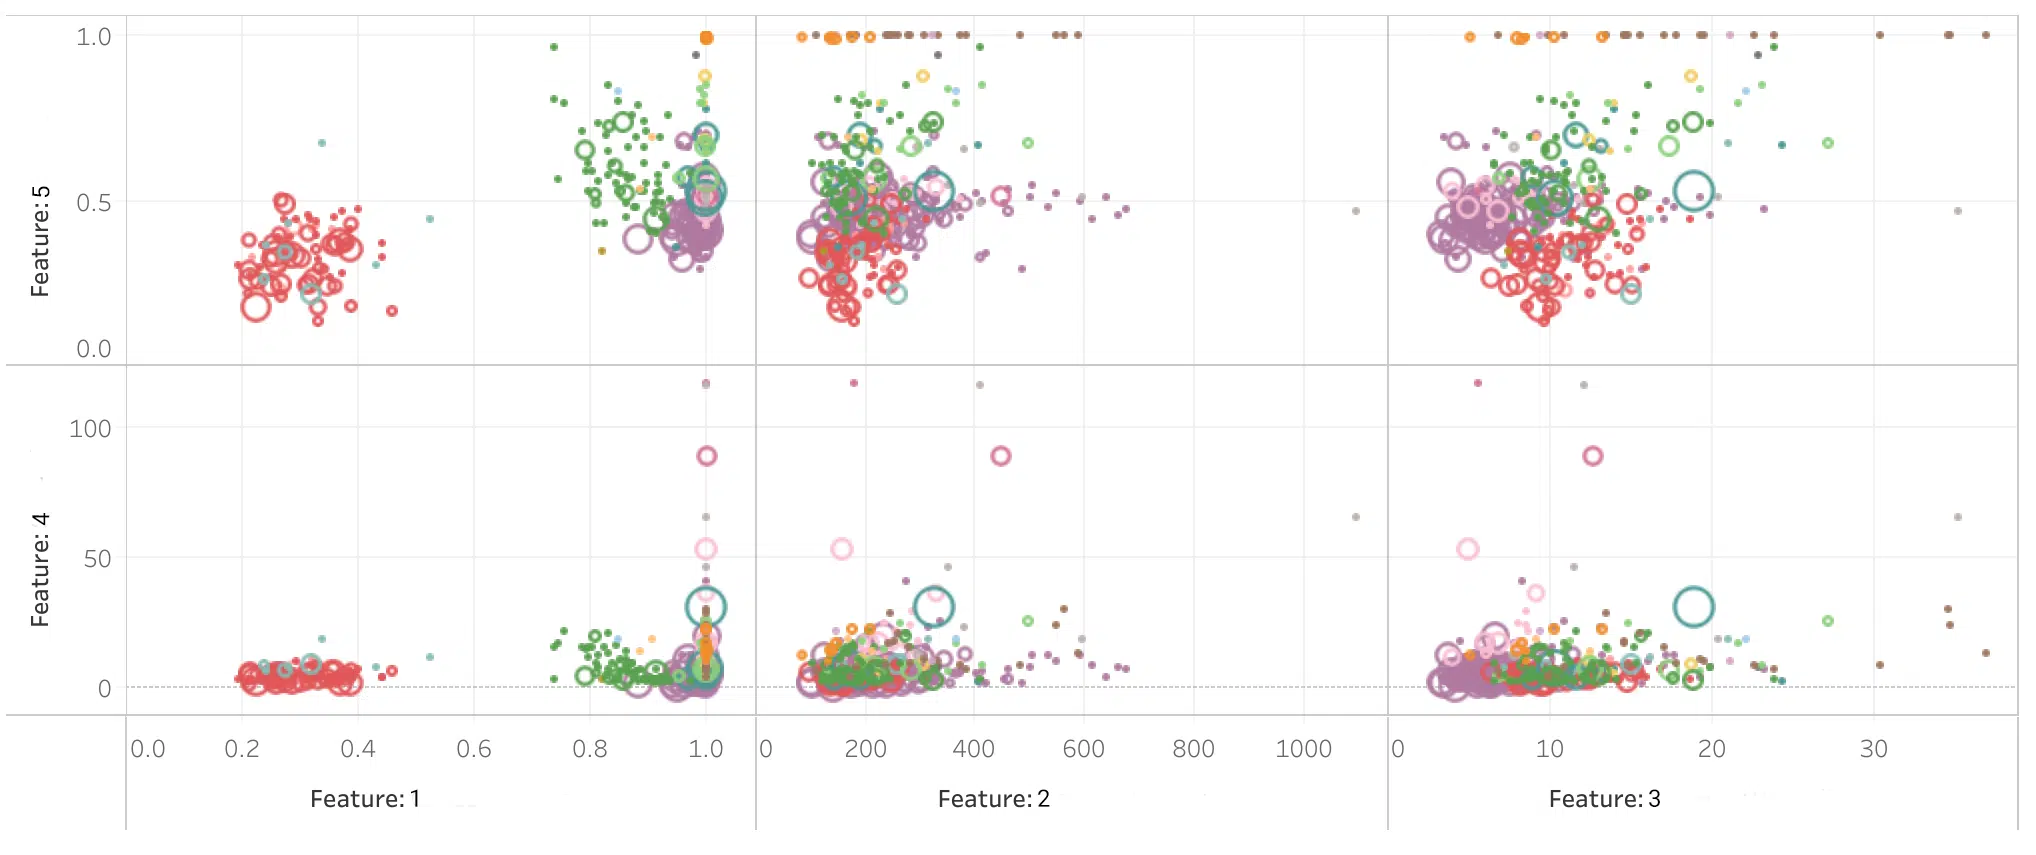
The chart below shows a sample of the features that we study as potential candidates for use in our pre-trade models. In this case, we are looking at the relationships between a set of properties or ‘features’, comparing one with another to see how they are correlated. To create our desired model, we will combine the features through weightings, taking care to use features with strong predictive power but that are not correlated with one another.
The chart reveals how shares with similar correlations between various features cluster together (a cluster is identified by its colour), signifying the relative importance of each pair of variables to each cluster. A data point in the top right quadrant shows the strongest relationship and therefore a strong candidate for inclusion in the model.
Cluster Analysis of Factors for Use in Pre-trade Modelling

This is a classic machine learning activity, especially given the sheer scale and complexity of the data when the problem is approached on a regional or global basis, and involves over 100 substantial trading venues. In particular, given regular changes in market conditions, market structure and factors which affect an individual share such as its float, the exercise must be regular and continuous. Taking post-trade data as regular sample datasets to monitor and refine the models becomes a continuous improvement task taking great skill not to ‘overfit’ a model and cause it to lose some of its predictive power during variable trading conditions.
At big xyt, our portfolio pre-trade service, in combination with our Open TCA solution, enables us to create models that best represent the nuances of trading flows that are normally specific to a client. If you would like to know more, please get in touch.
****
All the content here has been generated by big xyt’s Open TCA dashboards or API.
For existing clients – Log in to Open TCA.
For everyone else – Please use this link to register your interest in Open TCA.


