A common discussion topic at this time of year is the family debate/battle to decide which Christmas movies to watch before the final, final, finale of Gavin & Stacy is broadcast… and what could be more heartwarming than to enjoy the tale of a hairy creature with his old hat, battered suitcase, duffel coat and love of marmalade sandwiches? No, not the new Netflix biopic about Jeremy Corbyn, but rather the Paddington movie(s).
Yes, but what is the big xyt link from Paddington to the importance of data analytics? Well funny you should ask as the Paddington producer is none other than Canal Plus, spun out of Vivendi to list on the LSE only just yesterday. With continued press observation that UK companies are looking to the US to list, this is a welcome boost in the ongoing campaign to Make Europe(an Equity markets) Great Again.
It also allows us to showcase another example of our intraday analytics generated in real time and in this case showing the intraday market share of CANAL+ as it trades for the first time on the LSE (surprised the ISIN has a French rather than Peruvian prefix).
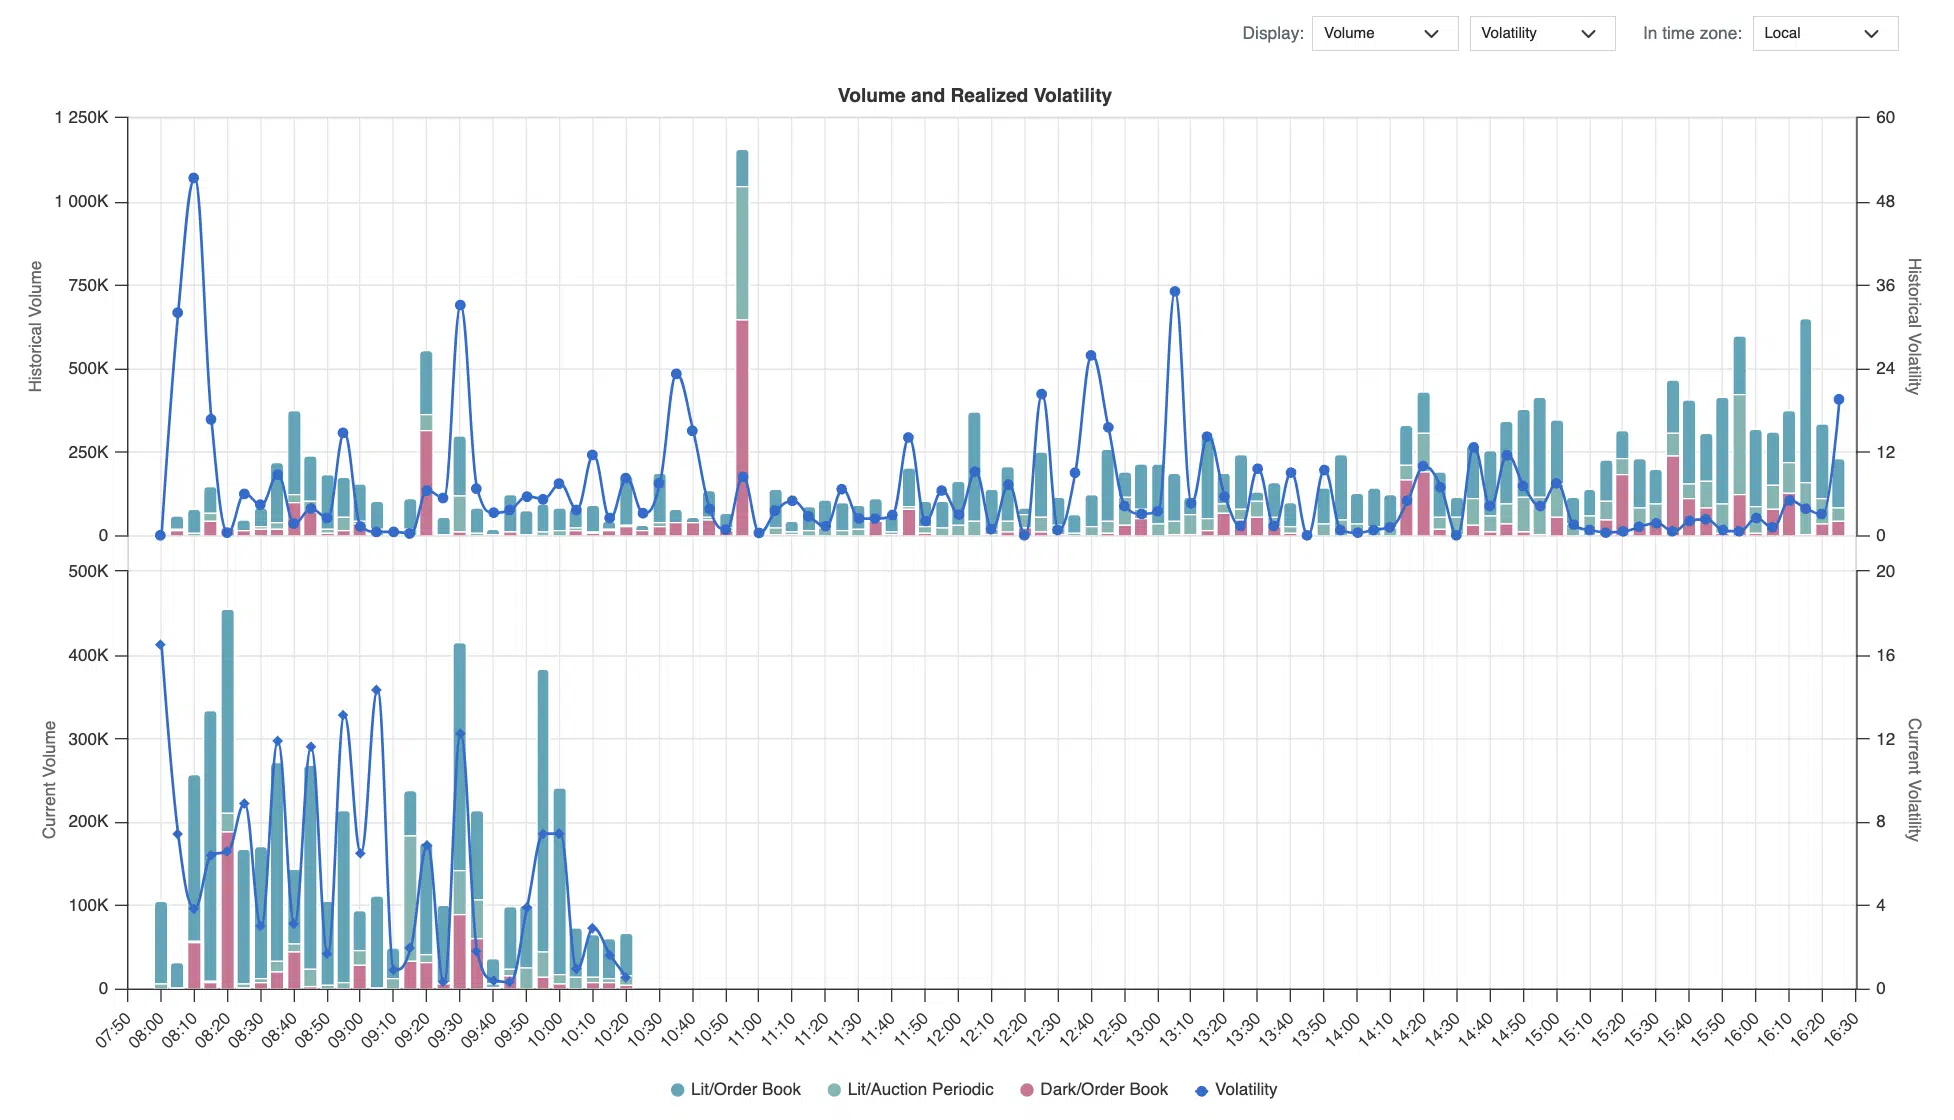
In the first chart we can see how the aggregate liquidity was distributed across mechanisms yesterday, and in the second, we can see how the volumes are developing today in comparative volume curves – developing before your eyes throughout the day. As mentioned last week this can also contribute to Market-on-Close estimates. The snapshot is from today at the time of writing.
Chart 1

But what a trader really needs is an idea of a sweet spot of liquidity by mechanism and venue to guide order placement – especially when dealing with sensitive large orders.
Chart 2
Chart 3 is a picture of market share across venues AND mechanisms – this is beginning to show us, with the help of a heatmap, where we should be looking for liquidity
Chart 3
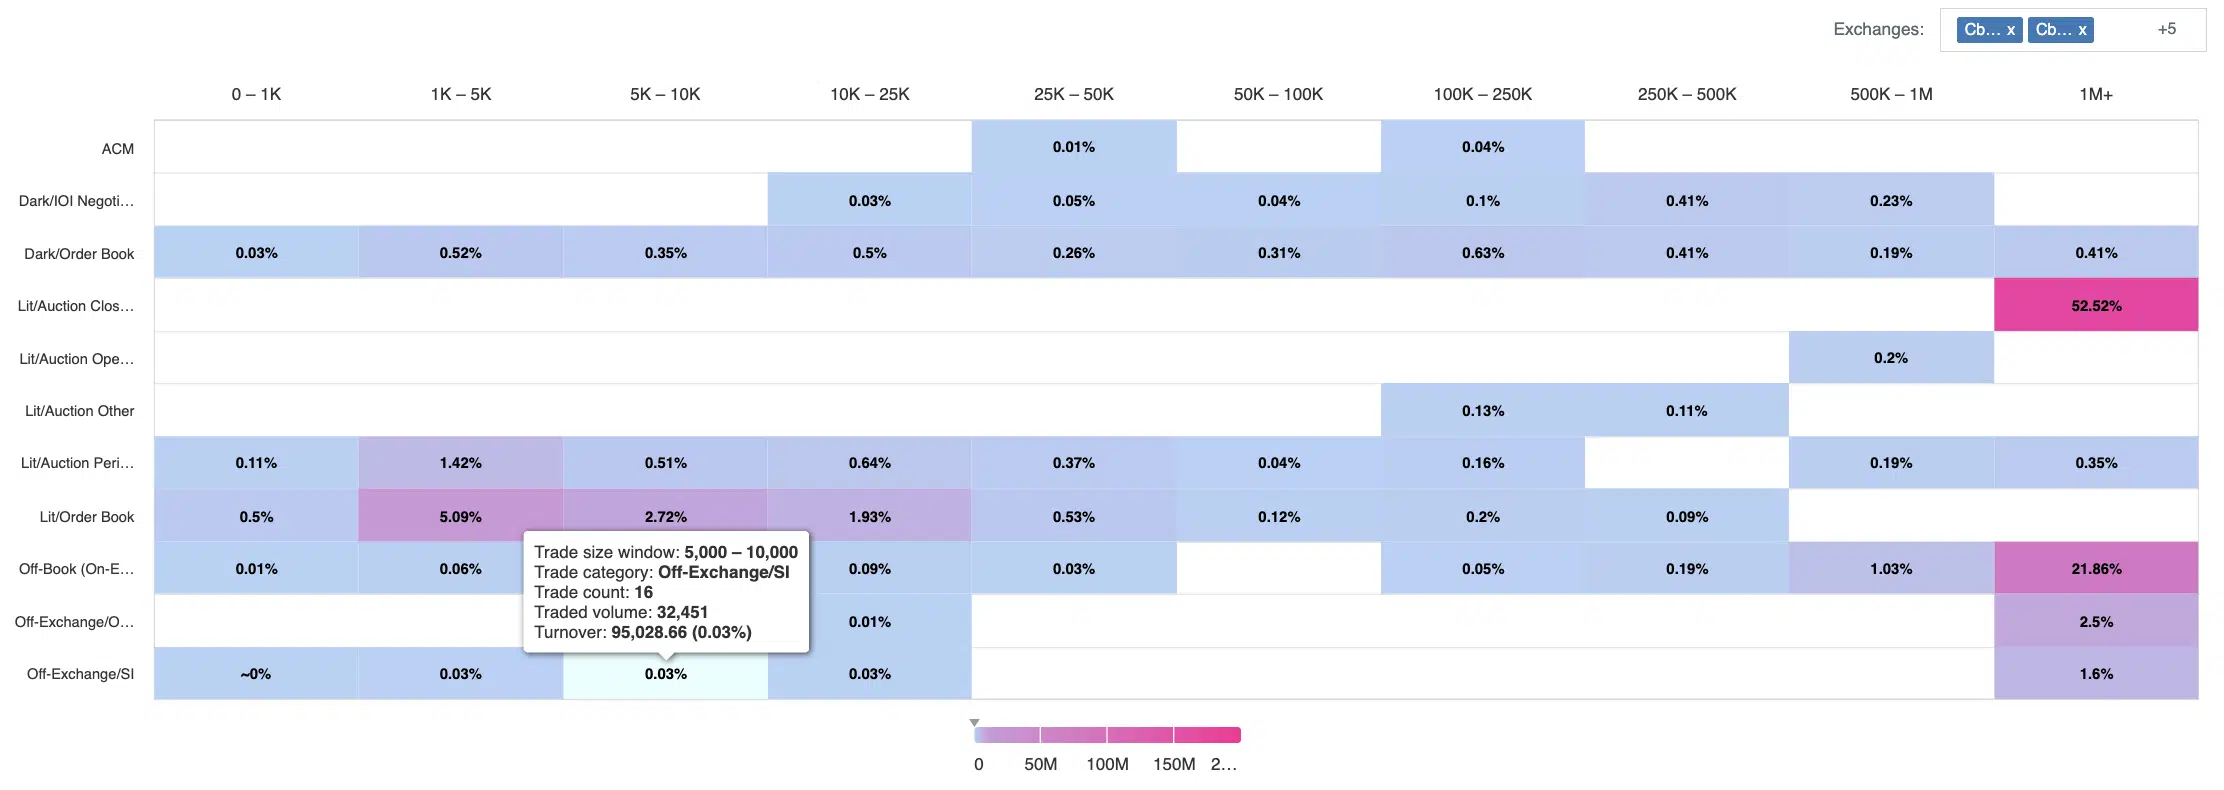
Chart 4 takes this a stage further by introducing size buckets – now we can see a sweet spot for our order size by venue.
Chart 4
….and in Chart 5 by Liquidity bucket and Mechanism to complete the picture.
Chart 5
We wish Paddington and Canal Plus well on their journey and let’s hope it’s not the start of a bear market.
Independent pre-trade analysis can support implementation of investment strategies for baskets as well as individual stocks without leaking any information to the market. We are using AI and ML to augment and enhance the use of traditional models and would welcome the opportunity to discuss your requirements to utilise our research capabilities.
****
All the content here has been generated by big xyt’s Open TCA and Liquidity Cockpit dashboards or API.
For existing clients – Log in to Open TCA, or log in to Liquidity Cockpit.
For everyone else – Please use this link to register your interest in Open TCA or Liquidity Cockpit.


