While tracking a recent delivery on the Amazon app, I couldn’t help but notice that Santa was out on the sleigh very close to my street.
I couldn’t be sure whether he was testing the equipment or just practising, but it got me thinking about how the old fella could drop off so many parcels in just one evening. It suddenly dawned on me that he must be in more than one place at the same time. It’s a bit like a dual listing.
Tracking liquidity matters to corporate issuers as much as to investors because their shares must be easy to trade with minimal cost, and they need to be able to keep investors informed of activity in the market. Being part of one or more indexes is crucially important to attract investment from benchmarked funds, both passive and active, while the inexorable rise of ETF investment plays a major role in acquiring investors. Among many other factors, this leads to companies seeking additional listings to take advantage of liquidity patterns.
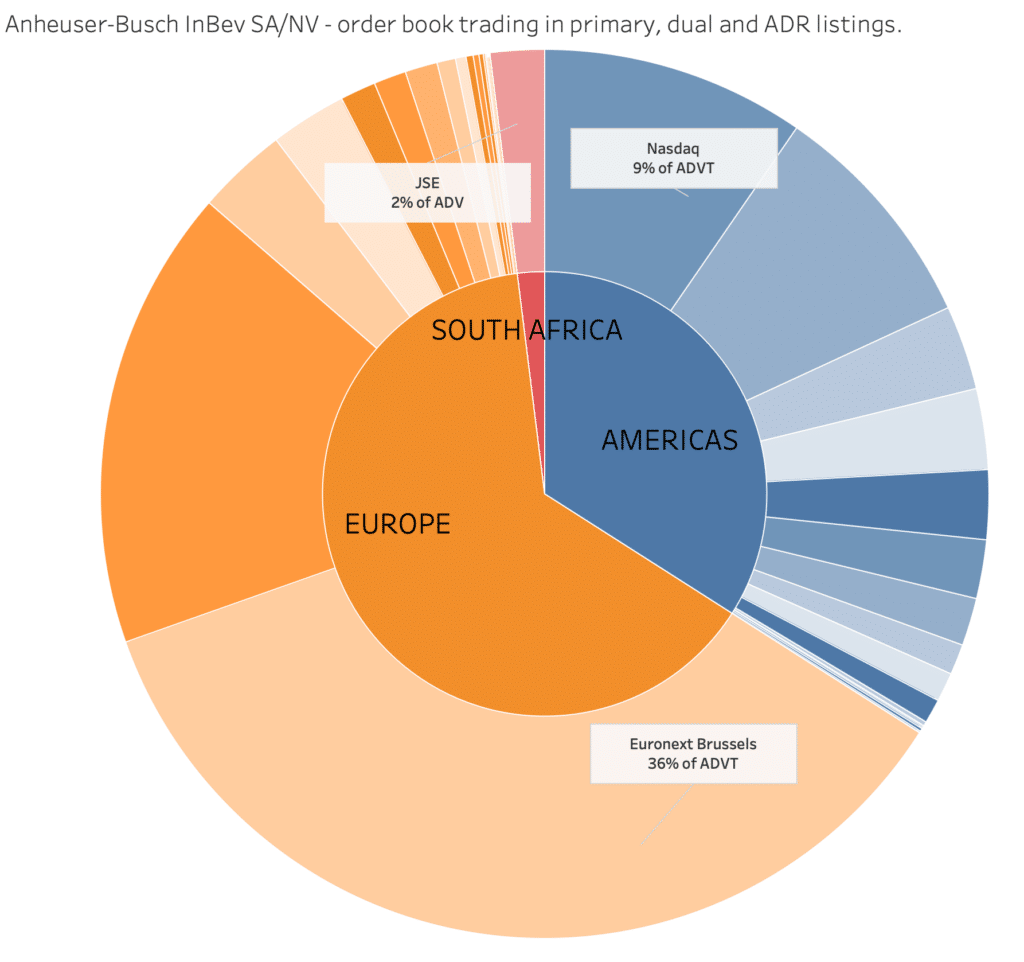
Today’s chart shows the many places to trade the various listings of the beverage sector’s Anheuser Busch, with its primary listing on Euronext Brussels where it trades 35% of volume and nearly as much again on all other European venues. Meanwhile, it has a dual listing in South Africa (2%) and US ADRs traded under the BUD symbol (for Budweiser) worth a substantial 34%. Each slice represents the ADV for each underlying venue for on order book trading. We see for example that the ADR accounts for around a third of all liquidity (but not counted in any European index).
In another recent example, we saw Ferrovial SA (from the IBEX index) merge into its own international entity and dual list the shares in Amsterdam and Madrid, while also announcing plans for a US listing, to “strengthen its international profile”. This gives the company exposure to two additional indexes, the ever growing NL25 and the US mid caps series.
With trading volumes in Europe continuing to wallow around their long term constant level, it is no surprise that companies should seek to optimise their listing structure to maximise liquidity and participate in index trading across multiple regions.
We believe that dual, secondary and alternative listing data, for both volumes and trading metrics, is a key tool for corporates, traders and investors alike in understanding the true liquidity profile of an asset pool.
****
All the content here has been generated by big xyt’s Liquidity Cockpit dashboards or API.
For existing clients – Log in to the Liquidity Cockpit.
For everyone else – Please use this link to register your interest in the Liquidity Cockpit.


