Having a team of super smart data scientists who use a consistent methodology on a well curated data set can bring enormous benefits when exploring new ideas. The deployment of new business logic to discover fresh insights can be applied historically as well as going forwards. This provides immediate context for those impatient to see if a trend is present.
At the beginning of December we updated you on our latest views to follow the growing number of alternative closing mechanisms.
New innovative ways from MTFs to trade at the Closing Price were joined by primary exchanges introducing Trading at Last mechanisms.
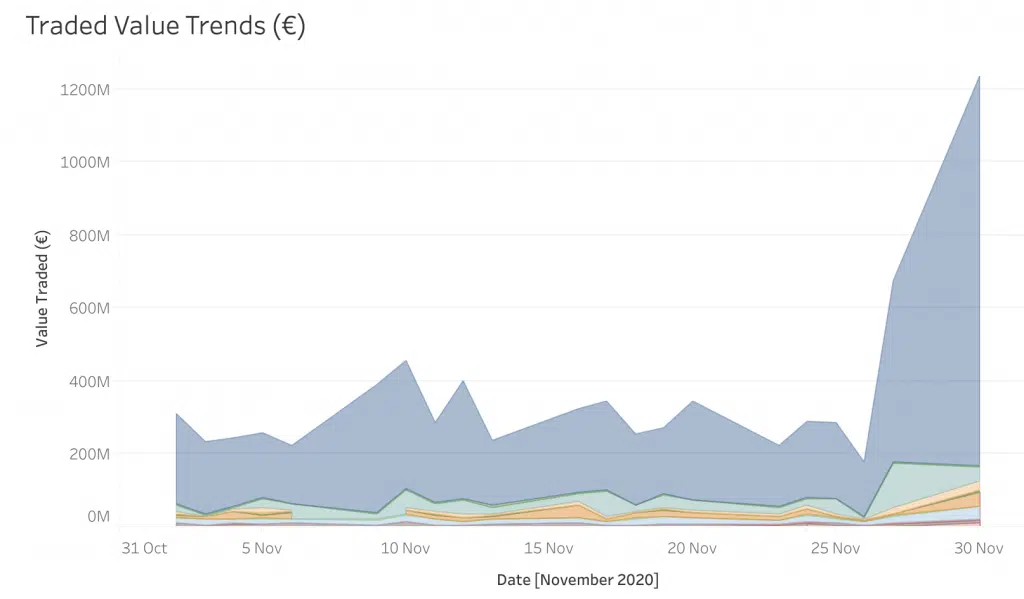
These are becoming genuine alternatives for certain flow targeting the close, as is clear from the first chart covering the daily value traded during November 2020.
Our curiosity with Over the Counter and Systematic Internaliser activity has lead us to capture after hours OTC and SI prints at the closing price.
This proxy for SI activity requires certain assumptions in order to capture the targeted trade reports – we are always transparent with clients in our methodology.
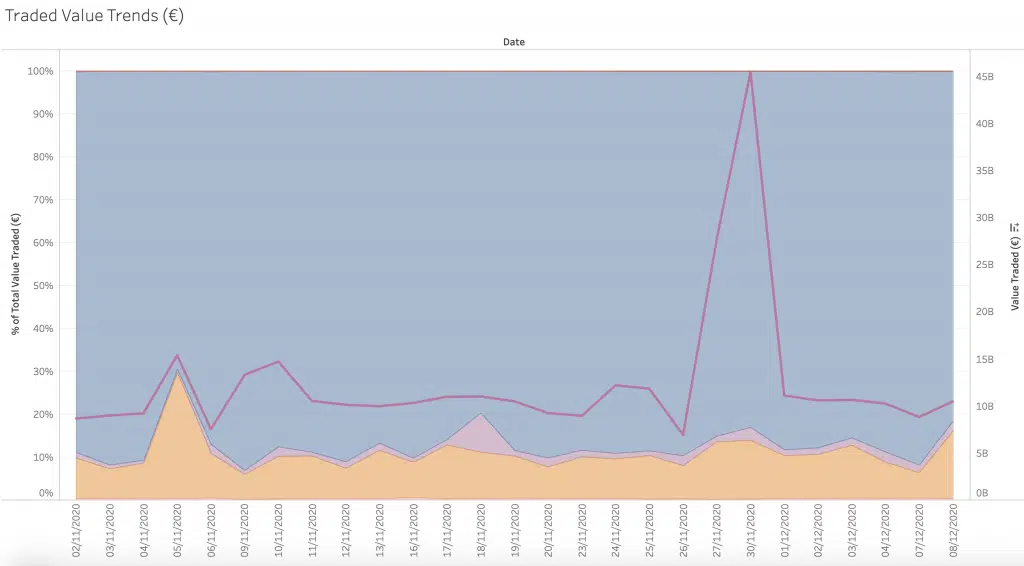
What we discovered was quite a surprise. In today’s second chart we have taken this analysis a stage further by introducing another two layers.
The pink line is total daily value traded at the closing price. The large blue area is the share of that value reported using traditional exchange auctions and the new alternative mechanisms, in other words on venue closing volume.
The thin pink market share segment is OTC volume reported after hours at the closing price, with the remaining orange segment using our proxy for SI volume at the close. That 10% of the total closing turnover trades on SI (considerably higher than the current share of alternative mechanisms) is significant.
Occasionally that share has higher peaks such as when it touched 30% on 5th November. Within that overall share we see several cases where individual stocks appear to trade significantly more through SIs at the closing price.
Any ideas what is being booked this way and by whom? Answers on a postcard please.
*****
Please let us know if you are interested in gaining access to this, or other data.
All the content here has been generated by big xyt’s Liquidity Cockpit dashboards or API.
For existing clients – Log in to the Liquidity Cockpit.
For everyone else – Please use this link to register your interest in the Liquidity Cockpit.
Oh and one last thing: We’ve been nominated in the A-Team’s TradingTech Insight Awards Europe for 2020, in the Best Transaction Cost Analysis (TCA) Tool and the Best Trading Analytics Platform categories. Please vote for us here.


