by Mark Montgomery, big xyt
Day 11 – SpaceX for Stocks
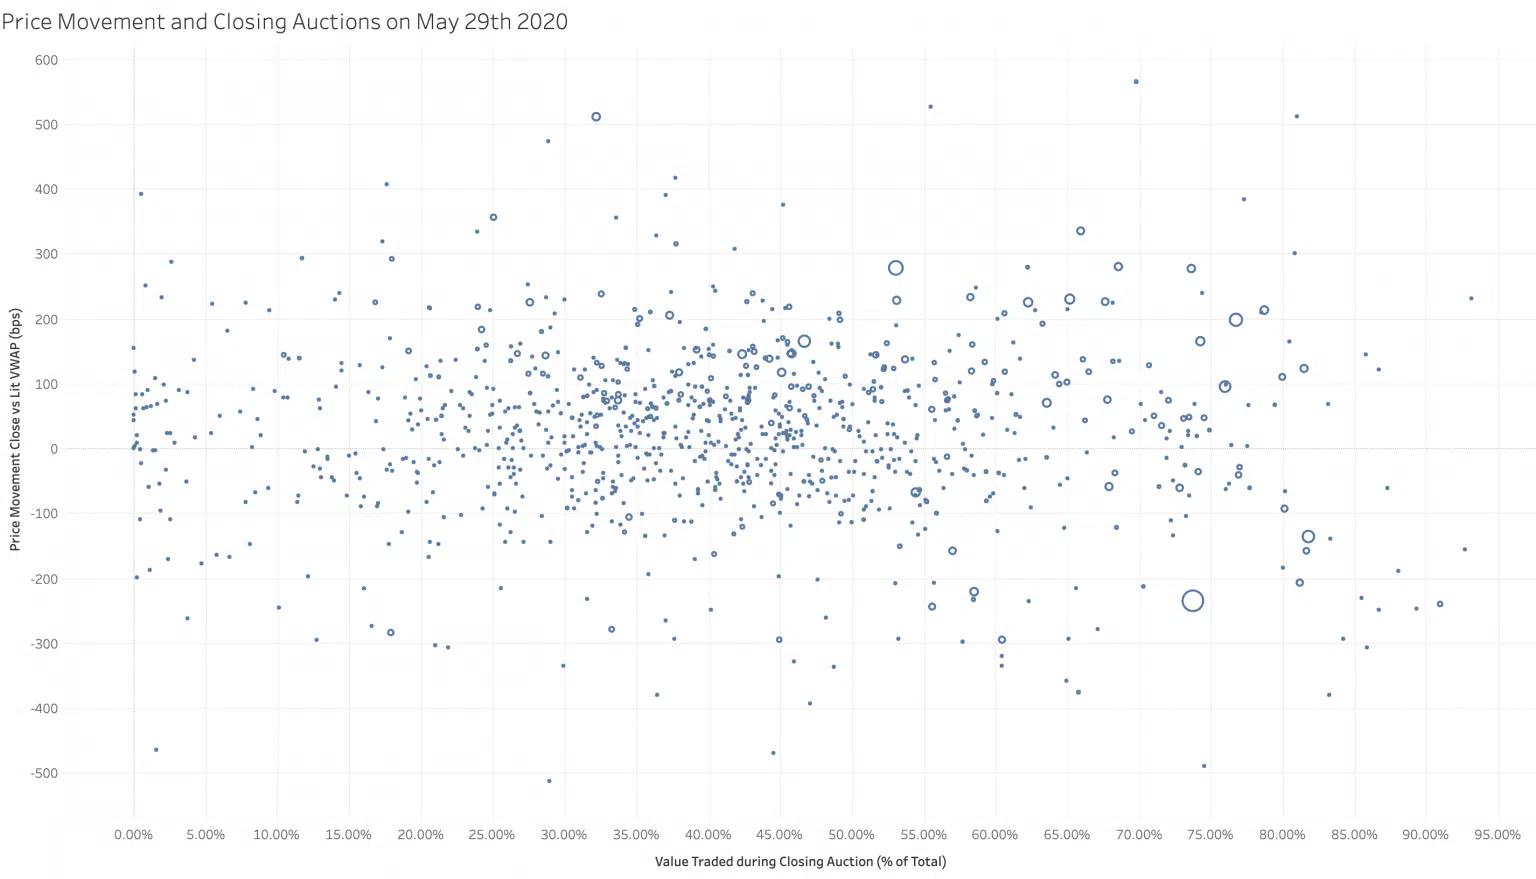
Some of you may have been straining your eyes looking at the night sky during the recent SpaceX launch. The image above isn’t a photographic negative image of heavenly bodies, it is actually a scatterplot of multiple European stocks. The Y-axis measures the difference between lit intra-day VWAP and closing price versus % daily volume traded at the close on the X-axis.
An accurate and well maintained granular financial dataset combined with powerful visualisation tools can be like introducing an amateur astronomer to a powerful new telescope. On 29th May, the day of a large index rebalancing trade, we saw significant increases in volumes traded at the close as mentioned in our post last week. Using scatterplots like this we can see the stocks with the largest percentage of their daily volume in the close, combined with another dimension. This measure shows the difference between the closing price and the full day Volume Weighted Average Price (VWAP) excluding the auction print. Stocks that were announced for addition or deletion do not necessarily show the largest price move during the Closing Auction. Many other stocks are more affected both positively & negatively. On average the stocks selected in this pan-European universe saw a closing price deviation of 1%. That means for the €33bn traded in the closing auction that day, there was a total cost or profit of €300mn depending on whether you were on the right or wrong side of the decision to trade in the auction.
This would seem to be a warning to be careful trading at the close on these special days. It should make some question whether the Close is an appropriate benchmark for all who see a “Liquidity Event” as more important than a more patient approach to preserving alpha.
It would seem that for every shooting star there may be a black hole lurking.
The attached screenshot was created with our Liquidity Cockpit API. In subsequent posts we will reveal the identity of some the outliers above and drill down into the detail with a new analytics tool. Watch this SPACE.
At big-xyt we can provide daily time weighted spreads & depth for users and algo developers in 12,000 instruments and all significant venues, as well as many other essential trading metrics. If you are interested in letting us do some of the heavy lifting for your algo infrastructure please get in touch.
If you find these pieces of analysis useful, you will find there is a lot more you can do with our Liquidity Cockpit. Clients using our Execution Analysis/TCA are able to measure execution performance with the demonstrated precision and flexibility.
Do you want to receive future updates directly via email? Use the following form to subscribe.
On our x Days of Isolation
During these unprecedented times we do not underestimate the professional and personal challenges that everyone is facing. There are far more important things to be doing in the community than looking at a screen.
However, data and data analytics is playing a critical part in providing solutions to the current global crisis. Furthermore, the markets remain open and whilst they do, the trading community needs to be well informed in order to understand the changing market landscape. As a result, big xyt is receiving an increasing number of requests for observations of changing trends and behaviours in the equity markets. We are excited to have recently expanded our London team to enrich our content and support for clients seeking greater market insights from an independent source. Whilst many adjust to the new experience of working from home we plan to share some of these thoughts, observations and questions in the coming days & weeks.
As ever we welcome feedback as this can shape further contributions from our team and the Liquidity Cockpit our unique window into European equity market structure and market quality.
We hope you enjoy them.
—
This content has been created using the Liquidity Cockpit API.
About the Liquidity Cockpit
At big-xyt we take great pride in providing solutions to the complex challenges of data analysis. Navigating in fragmented markets remains a challenge for all participants. We recognise that the investing community needs and expects continued innovation as the volume of data and related complexity continues to increase.
Our Liquidity Cockpit is now recognised as an essential independent tool for exchanges, Sell-side and increasingly Buy-side market participants. Data quality is a key component, as is a robust process for normalisation so that like-for-like comparisons and trends over time have relevance. However, our clients most value a choice of flexible delivery methods which can be via interactive dashboard or direct access to underlying data and analysis through CSV, API or other appropriate mechanism.
For existing clients – Log in to the Liquidity Cockpit.
For everyone else – Please use this link to register your interest in the Liquidity Cockpit.


