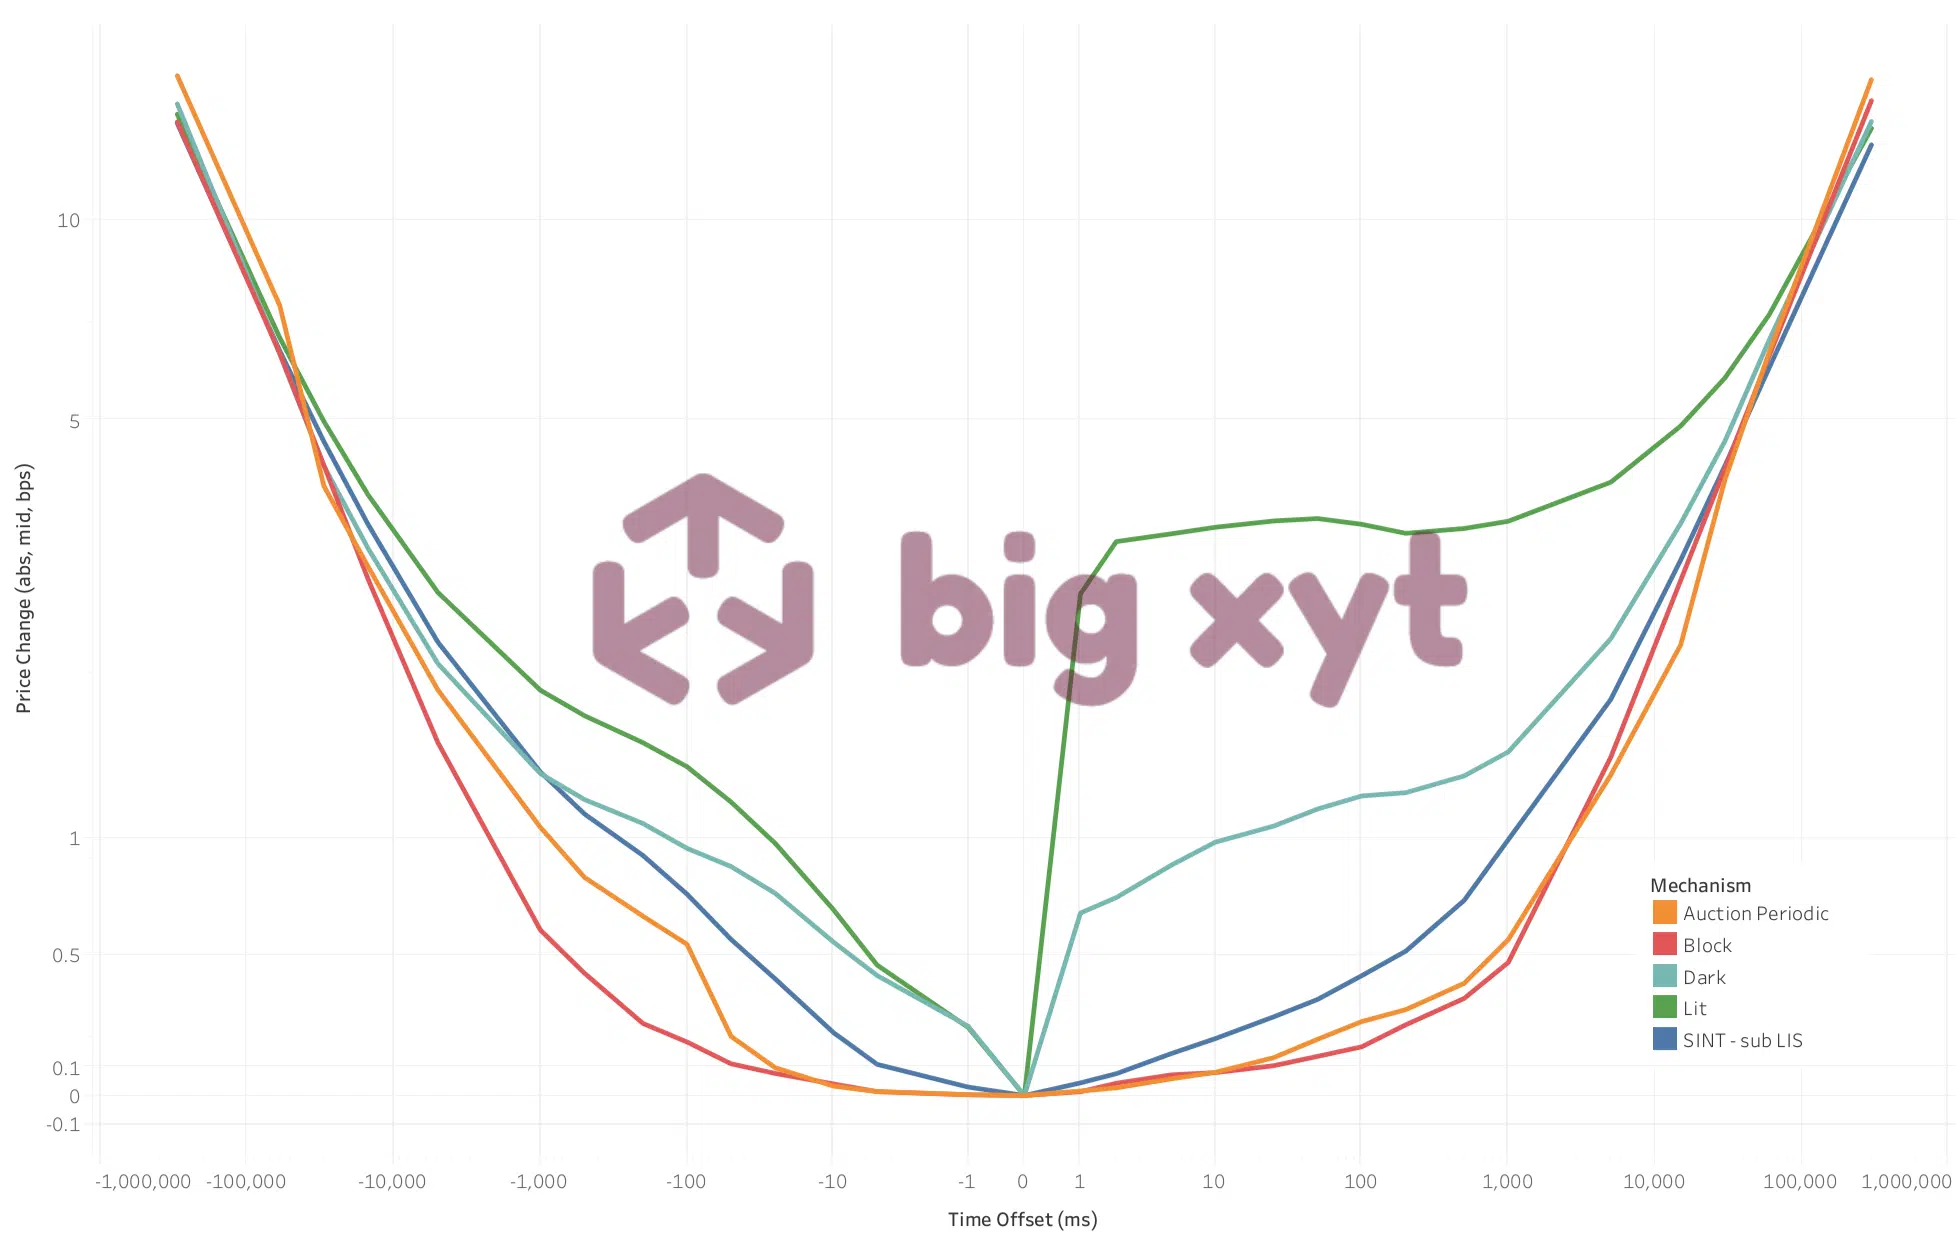
For participants in the European equities markets, the use of smart measures around price movements before and after each trade can help to better inform execution decisions, and therefore optimise and improve execution quality. By capturing every tick in the market for each stock across all venues, we can see how a share price moves before and after each trade. In normal circumstances, most liquid stocks can be expected to trade at least once within a five-minute period, certainly it is likely that a movement will occur in the bid or ask and therefore the midpoint. We can measure either the percentage likelihood of a move within the time period or the magnitude of the price change in basis points at a given interval.
Monthly Archives: May 2019
Filter by:
Categories
-
In the Media
-
12 Days of Trading 2024
-
12 Days of Trading 2023
-
News
-
Views
-
European Equities Microstructure Survey
-
European Market Structure Microbites
-
12 Days of Trading 2022
-
12 Days of Trading 2021
-
12 Days of Trading 2020
-
12 Days of Trading 2019
-
12 Days of Trading 2018
-
X Days of Isolation
-
Uncategorized
![]()
![]()
© Copyright 2025. All Rights Reserved.