Day 10 of 12: Price Movement – Closing Auctions
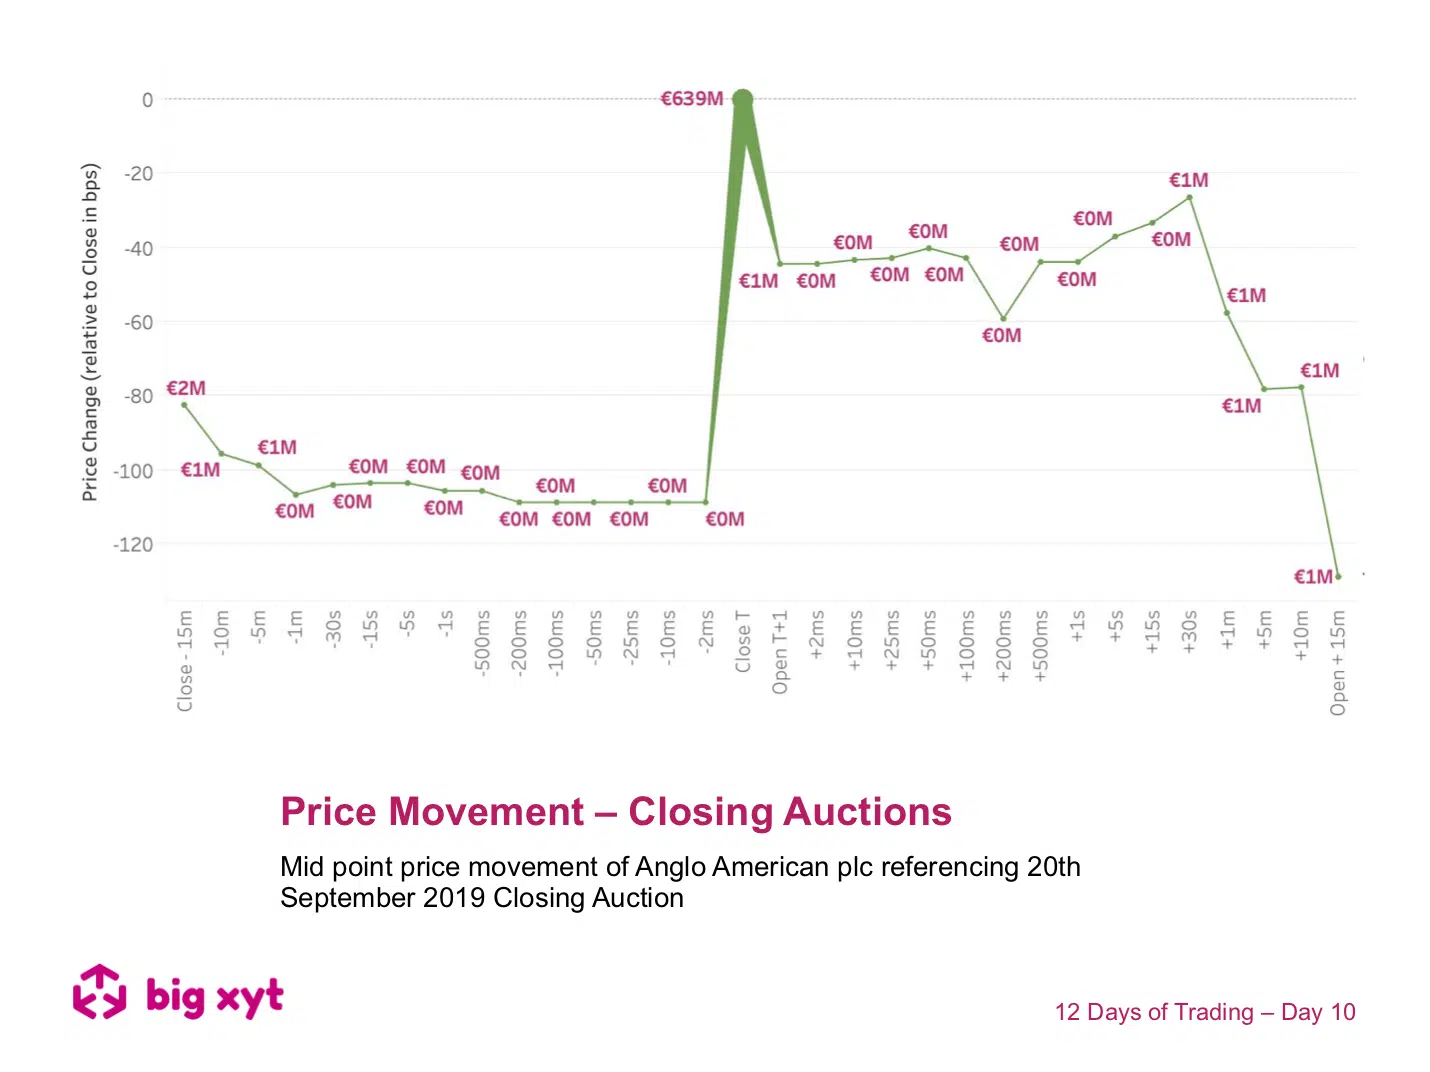
Mid point price movement of Anglo American plc referencing 20th September 2019 Closing Auction
Following previous observations of the growing significance of the closing auction we felt curious as to whether a benchmark price should be the best driver of liquidity. As we saw yesterday, investors were quick to embrace the opening auction and trade more throughout the day when trader/fund manager conviction is higher such as last Friday 13th. So what happens on days when closing volumes are greater, such as index rebalance and derivative expiry days?
As you may have seen, we have examined intraday price movement in the past to compare market mechanisms. Today we are introducing a view of movement around the closing price.
The chart shows the UK stock Anglo American on 20th September (a derivative expiry day). The line shows the change (in Basis Points) of the mid point price of the stock relative to the close from 15 minutes before to the first 15 minutes of trading the following day. The thickness of the line represents the value traded.
What we see is a 1 percent move into the close which reverts 40 basis points on the opening print the next day and fully after 15 minutes trading. For £640mn turnover at the close that’s quite a big win (or loss) for choosing to trade at the close. Worth noting that the underlying price momentum appears to be in the other direction.
Anyway, we only chose that stock as the symbol is first in the alphabet. If you want to look at the other 99 UK blue chips? Or the German or French Stocks affected? Or another key date? Maybe an index rebalance?
Liquidity Cockpit users are able to look at any stock this way and see the venues broken down. Clients using our Execution Analysis/TCA are able to measure execution performance with the demonstrated precision and flexibility.
We’re delighted to share that big xyt has been shortlisted for, not one, but two industry awards!
We have made the shortlist for ‘Best Trading Analytics Platform’ and ‘Transaction Cost Analysis (TCA) Tool for Best Execution’ at the TradingTech Insight Awards 2020. We’d really appreciate your support in gaining recognition for our work in the industry.
Please spare a few moments to vote for us here. Thank you in advance.
Do you want to receive future updates directly via email? Use the following form to subscribe.
On our 12 Days of Trading
As the year draws to a close we have been asked by clients to repeat our festive exercise on the 12 days leading up to the holidays. As a result, you will find a post to a different 2019 big-xyt observation each day. We look and highlight trends since the introduction of MiFID II with a focus on this year’s changes or events.
We hope you enjoy them.
—
This content has been created using the Liquidity Cockpit API.
About the Liquidity Cockpit
At big-xyt we take great pride in providing solutions to the complex challenges of data analysis. Navigating in fragmented markets remains a challenge for all participants. We recognise that the investing community needs and expects continued innovation as the volume of data and related complexity continues to increase.
Our Liquidity Cockpit is now recognised as an essential independent tool for exchanges, Sell-side and increasingly Buy-side market participants. Data quality is a key component, as is a robust process for normalisation so that like-for-like comparisons and trends over time have relevance. However, our clients most value a choice of flexible delivery methods which can be via interactive dashboard or direct access to underlying data and analysis through CSV, API or other appropriate mechanism.
For existing clients – Log in to the Liquidity Cockpit.
For everyone else – Please use this link to register your interest in the Liquidity Cockpit.


