Here at big xyt, we believe that Christmas is about both the liquid and the illiquid. A mulled wine is nothing without a mince pie, the turkey needs its gravy, and of course the Christmas pudding won’t flame without a drop of brandy.
As it happens, liquidity is in our veins and what better way to soak up some seasonal spirit than by reading our 12 Days of Trading (now in its 6th year). Welcome back to our (slightly tongue in cheek) review of our favourite charts.
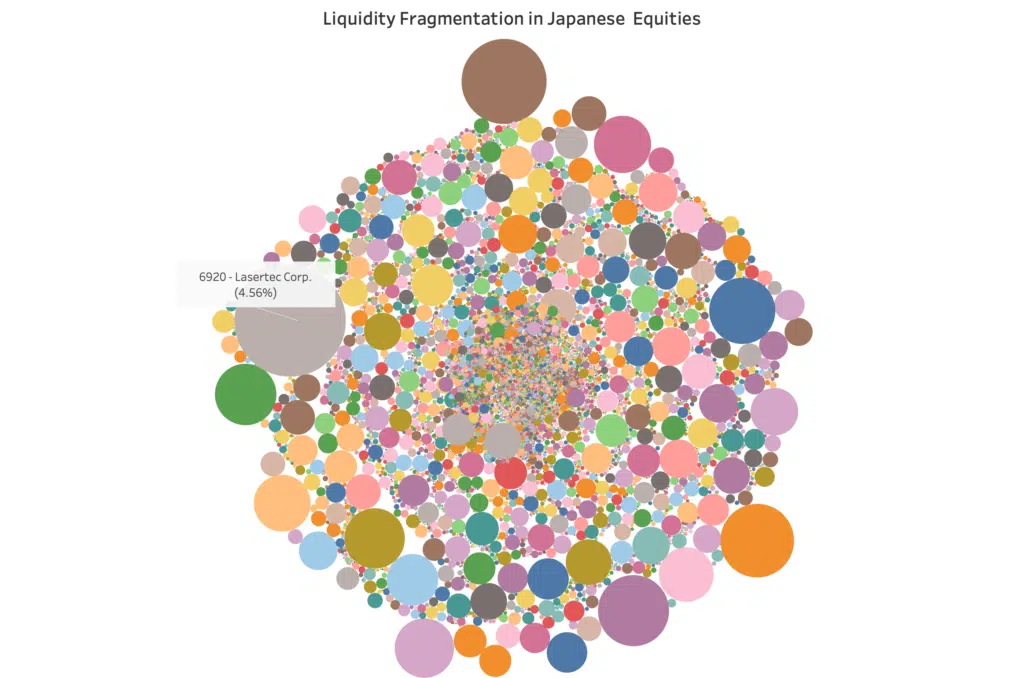
Just like Santa, we are starting our journey in the East. Evoking a slightly misshapen Christmas bauble, our first chart is a picture of liquidity fragmentation in the Japanese equity market.

Each bubble represents a single pool of liquidity – that is to say the average daily traded value for each stock, per lit venue, open or closing auction. The graphic represents 3,889 shares spread across the five major lit venues (operated by TSE, Cboe and Japannext) and either continuous or auction periods. It’s nearly 60,000 bubbles in total, each one an aggregation of hundreds of millions of trades over 242 trading days. This is a simplification as the chart does not include liquidity reported through JSDA or ToSTNet, where we find the dark trading and all other forms of off order book trading.
When we consider that algo trading engines need to keep track of all this complexity – every bubble has a volume curve, an average spread, a BBO to monitor – we begin to get a sense of the sheer scale of the trading task around the world and especially in fragmented markets. By the way, the biggest bubble represents 6920 (Lasertec Corporation) trading on TSE which alone accounts for 4.56% of overall lit order book trading.
If you would like to see a local version of this chart, please reach out to us.
****
All the content here has been generated by big xyt’s Liquidity Cockpit dashboards or API.
For existing clients – Log in to the Liquidity Cockpit.
For everyone else – Please use this link to register your interest in the Liquidity Cockpit.

