To finish off the week, the 12 Days of Trading 2022 continues its longitudinal leaping, this time southwards across the Alps from Prague to Bergamo, famous for its Elfredo pasta. Today’s festive topic is deer to our hearts; latency. Just like the big man’s sleigh, prices, orders and trades Dasher-ound Europe faster than a speeding comet, and to prove it, we have deployed our powerful techNoëlogy to bring you more festive graphs that will make your nose glow.
This year we saw a major part of the market’s trading infrastructure move 600 miles from London to Bergamo, when Euronext relocated its data centre. This involved nearly 25%, (more than 10B€ a day) of European on-order book trading. Some predicted that the extra distance between the London based MTFs and the matching engine could damage market quality. In extreme circumstances, delays to price updates and orders being routed could lead to participants trading at the wrong price or missing out on liquidity. We felt that this was a just Clause for a 12 Days of Trading episode.
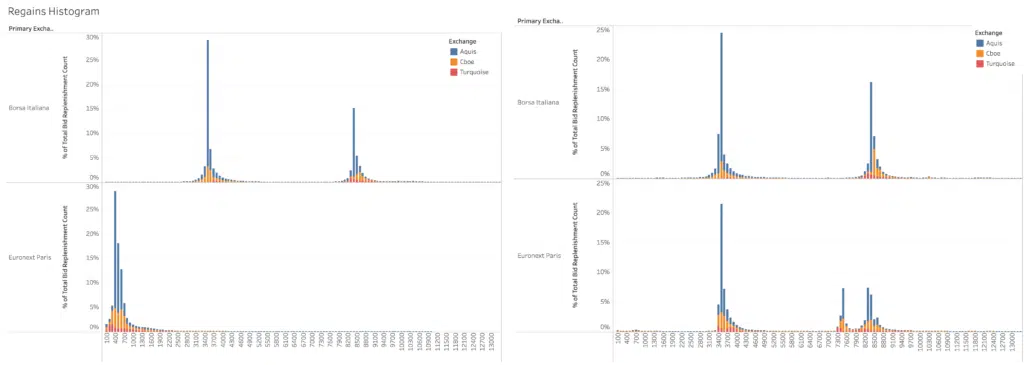
Our chart shows the additional latency produced by the move. Here, we see the average time taken for quotes on the London-based MTFs to ‘regain’ or catch up with a new EBBO set on Euronext. By the way, the measurement is identical when the Primary is regaining the MTFs. The histogram shows the distribution of regains per time bucket at 100 microsecond granularity, by MTF.
The left hand chart is for January to May (the move happened in June), and right hand chart above covers from July until yesterday. The move appears to add just over 3,100 microseconds of latency, or three milliseconds. Notice how Borsa Italiana (Euronext Milan) Notice how Borsa Italiana (Euronext Milan) does not change because its matching engine was already in the Milan area. The multiple peaks of activity indicate a mix of different strategies and network technologies by participants. All told, the time is minuscule and close to the speed that light takes to cover the same distance.
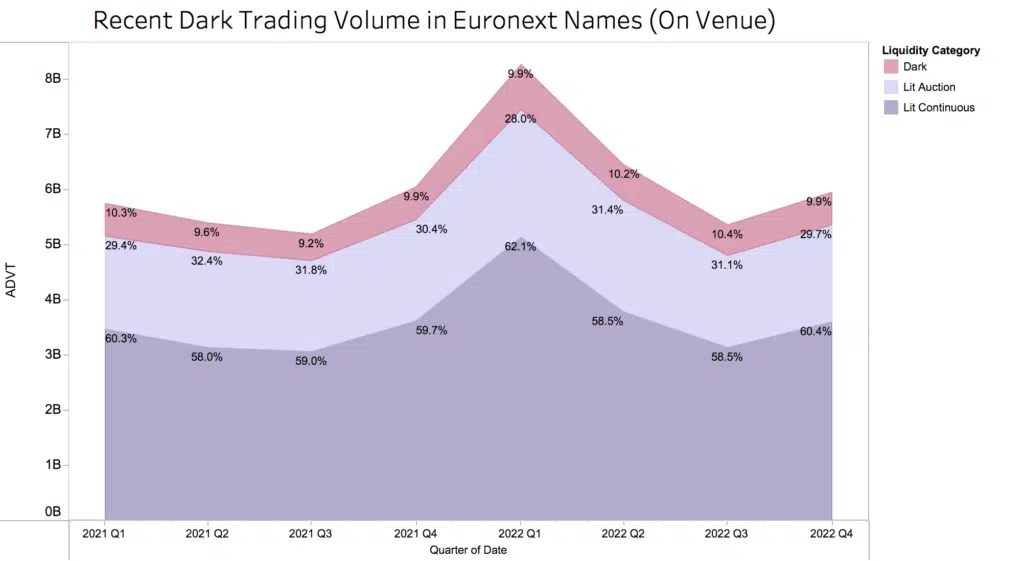
Unpicking the potential impact on market quality is a tricky business because there were many other themes at play in 2022. One very plausible view is that dark trading could reduce if the additional latency involved in delivering the reference price to London-based dark venues degraded the reliability of the MID. Our second chart implies that so far participants have not been put off, as the proportion of dark trading in Euronext names has held steady or even grown, year on year.
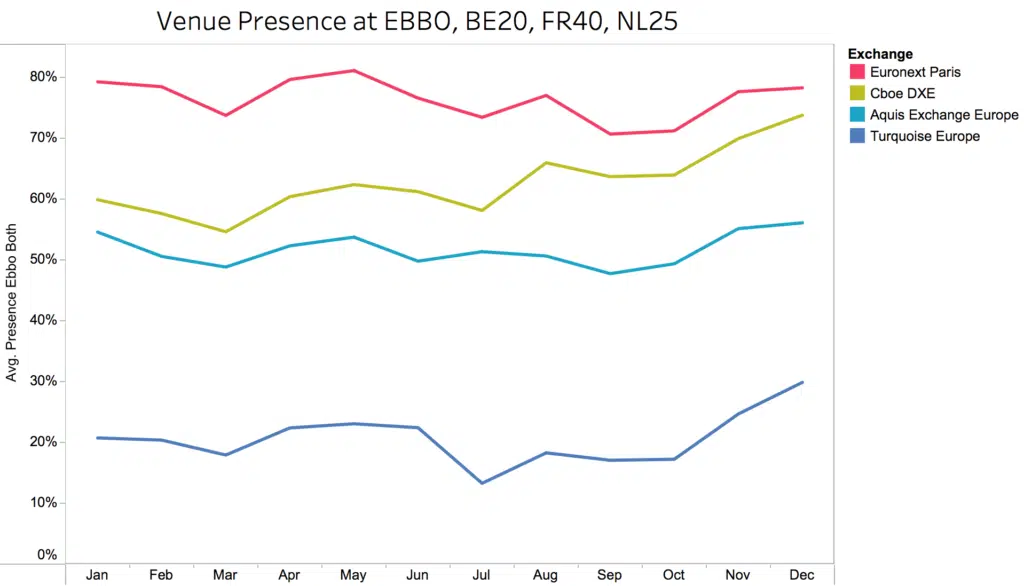
Using a few of our standard metrics we can look for other signs of significant impact. For example, in the next chart we look at whether there has been a change in the percentage of time during the day that each Lit order book is showing the EBBO – we call it ‘Presence at EBBO’. Ideally, all venues would show the same best price all the time, but don’t for many reasons including latency. Yet it seems that in the last few months all the venues have substantially improved their Presence, which is also echoed in a slight increase in overall touch size.
These patterns could have many causes, such as Turquoise launching their new liquidity contribution program, and we note that Cboe’s lit book has gained market share across the board and not just in the Euronext markets this year.
At this stage in the game, it is hard to point to the extra three milliseconds of latency and conclude that the data centre move had any negative impact. Another reason we can begin to relax, with only five business days remaining till the holidays.
****
All the content here has been generated by big xyt’s Liquidity Cockpit dashboards or API.
For existing clients – Log in to the Liquidity Cockpit.
For everyone else – Please use this link to register your interest in the Liquidity Cockpit.


