Father Christmas may not have target benchmarks or KPIs but he does have to manage and deliver all the presents to the correct recipients by the end of the day.
But hold on, it just occurred to us that this actually has a lot in common with a practice in equity markets. Managing index constituents during a rebalance with a target benchmark of the Closing Price.
We have observed how closing volumes have grown, particularly around index events, as this benchmark is recognised as key to passive and index funds. Now, thanks to the curiosity of our team of data scientists, we have the ability to delve deeper into the behaviour of market participants during these events.
In the following charts we look at what happened during the MSCI November semi annual review, with all changes due to be implemented as of the close on 30th November.
Volumes on that date are compared to the average for the three months before and the 12 days since. As a side note the volumes before and after are remarkably consistent – probably driven by the self propelling patterns of algorithmic trading.
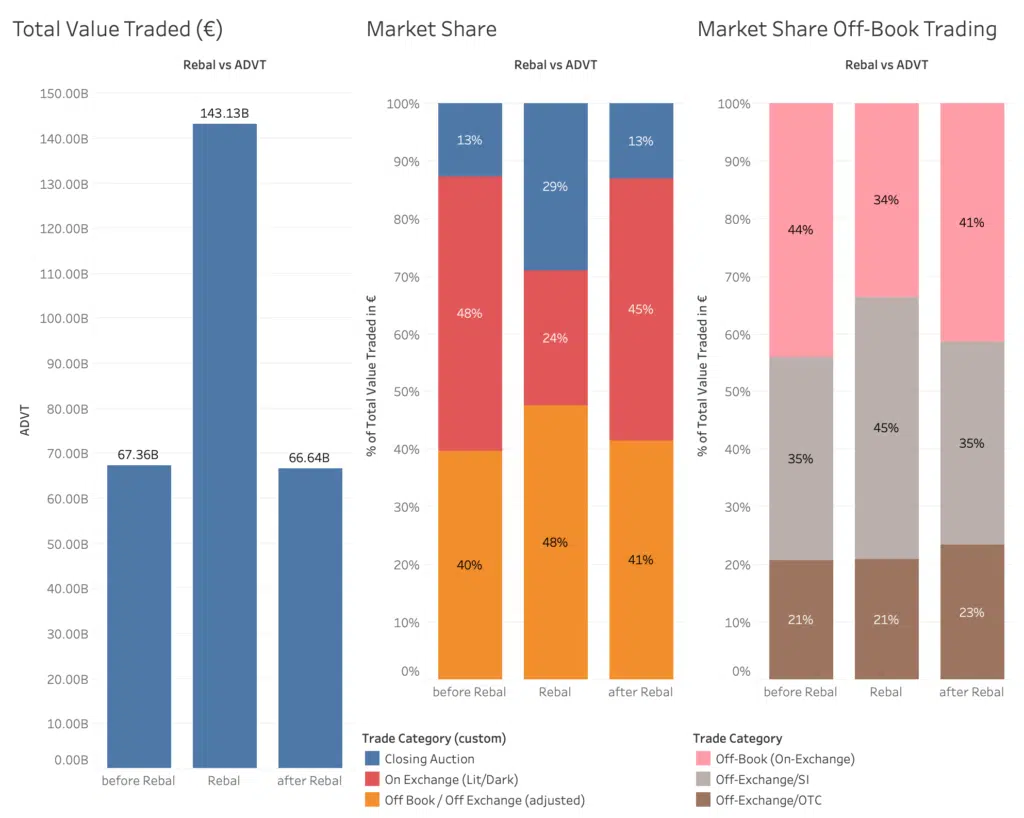
Figure one provides evidence that confirms our general observations but is perhaps surprising in its magnitude:
- Value traded in European equities on the 30th is more than double the average daily value traded (ADVT) before and after.
- Market share of closing auction volumes doubles at the expense of lit and dark activity in the same snapshot of time versus the average. We observe another area of temporary increased share in this chart which is our adjusted Off Book/Off Exchange category, which shows 48% up from an average of 40%.
- As this is the largest segment on the day of the rebalance we were curious to look in closer detail. Figure 1 ( sub header 3) shows that only one key area of off book trading increases market share on this rebalance day – Systematic Internaliser volume.
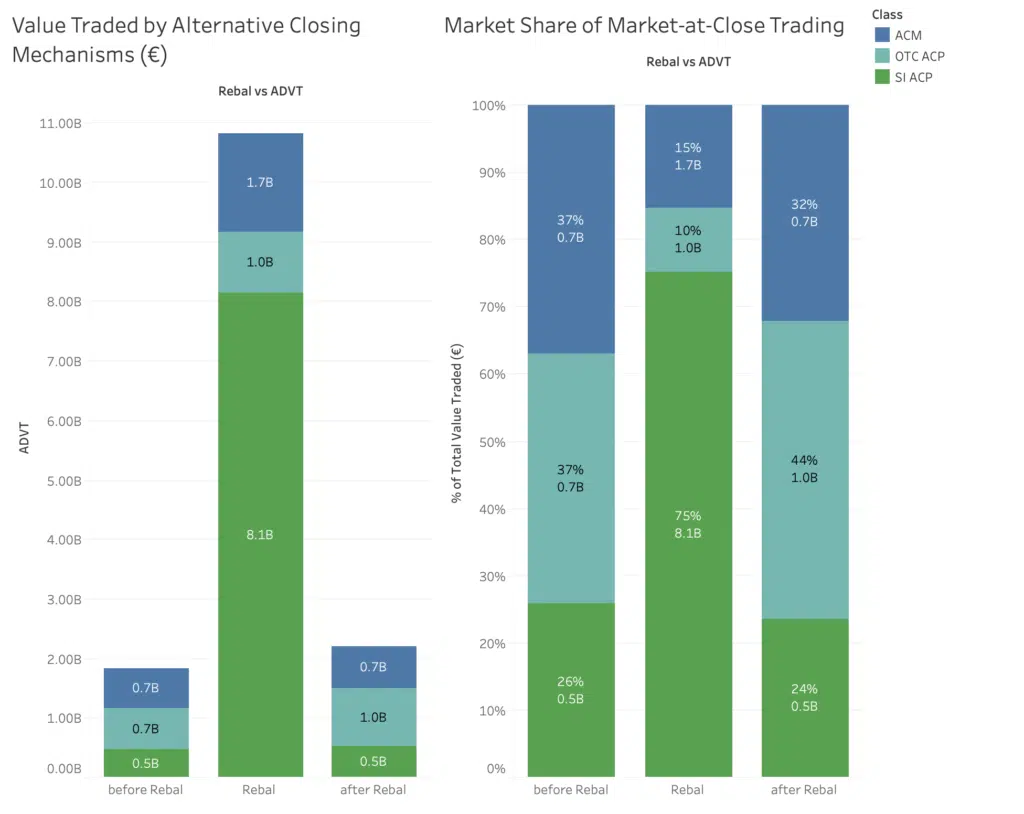
We really wanted to look deeper still (and this was made possible thanks to our recent initiative to look at alternative closing mechanisms and beyond), at alternative closing mechanisms and beyond.
These two charts (Figure 2) examine the value traded using these alternatives to the Primary closing auction and then their relative share. Aquis and Cboe have innovative new approaches to compete for this closing flow and this is covered by the ACM category. Our team further identified that a certain amount of volume is reported OTC shortly after the markets close at prices matching the Closing Price. They saw and captured this same activity in SI reports, and as you can see on the day of the MSCI rebalance it was significant.
€8bn EUR worth compared to half a billion on a normal day.
These changes are usually driven by cost savings or opportunities for short term profit, perhaps both. We have some ideas about why these SI volumes increase so much around these events and we would like to hear what you think. Do contact us to let us know your thoughts and in the meantime you can take a closer look for yourself…
The Liquidity Cockpit facilitates analysis focused on volumes going through the available closing mechanisms covering Primary, MTF, OTC and OTC/SI in our Alternative Closing Mechanism dashboards. View the trends over time or drill down to index or individual stocks to highlight the key areas of activity.
****
All the content here has been generated by big xyt’s Liquidity Cockpit dashboards or API.
For existing clients – Log in to the Liquidity Cockpit.
For everyone else – Please use this link to register your interest in the Liquidity Cockpit.


