As we gently ease into the festive season, the big xyt team is pleased to bring you Season 5 of the ‘The 12 Days of Trading’, a light-hearted look at some of the highlights of the trading year and its curiosities. This year, just like Santa, we begin our quest in the antipodes with a quick look at fragmentation in the region.
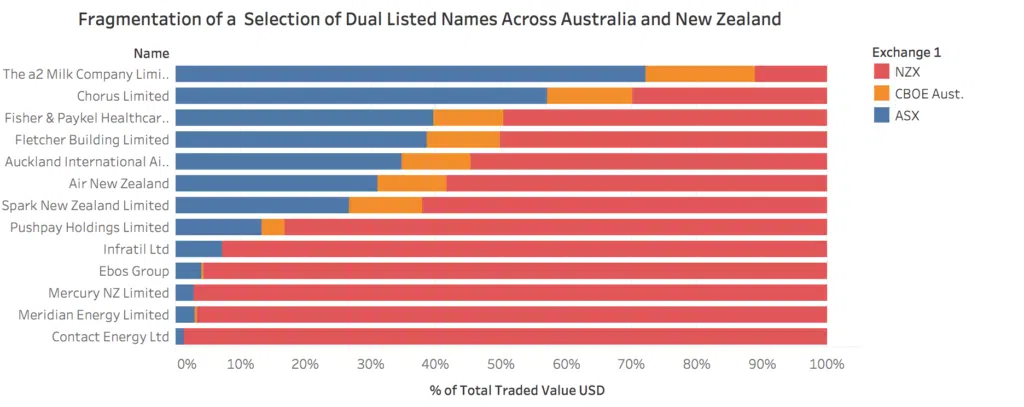
So why the Grinch? Well, a striking feature of the New Zealand market is just how much trading in some highly liquid listings (such as The A2 Milk Company!) actually takes place in Australia. It’s almost as if someone stole the Christmas presents. In our first chart of the festive season, you can see how volumes are distributed between the three main venues – NZX, ASX and Cboe Australia – indicating the balance between domestic and international trading in some of the bigger names.
 While we often concentrate on the shifting liquidity between venue types, this is an example of how dual listings are also a feature of fragmentation, often with foreign currency translations and post trade processes to complicate matters, and underlining the need for a steady supply of high quality market analytics.
Another good example of this is Prosus NV, the third most traded name in the Netherlands and number 31 in Europe at 400M€ per day, with a further 20% of trading in its home listing on South Africa’s JSE. Many ETFs are listed in multiple regions, collectively trading around the clock but with constituent underlyings that only trade during local market hours. Dual listings can provide pricing proxies for many of these funds when the markets are closed.
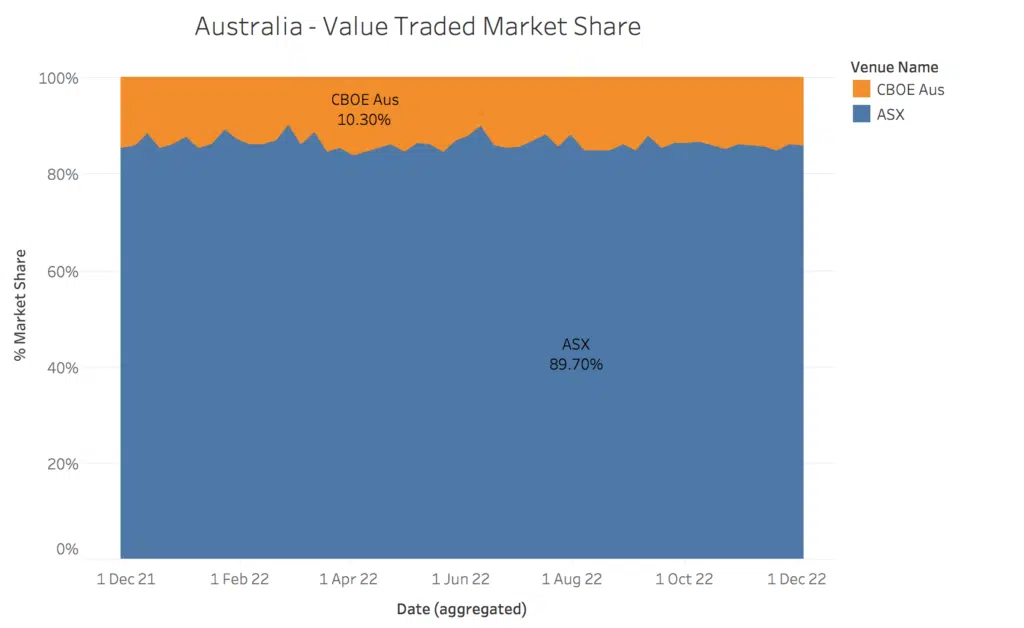
Australia and New Zealand are among a handful of countries in the region that have lit market fragmentation, alongside several dark venues. Within Australia two main venues compete for volumes (including over New Zealand dual listings), and this year we saw the entry of Cboe Global Markets with their purchase of Chi-X Australia.

If you have a quiet moment away from the ‘hurly burly’ of the last few trading days of the year and you would like to explore our global capabilities, please get in touch.
****
All the content here has been generated by big xyt’s Liquidity Cockpit dashboards or API.
For existing clients – Log in to the Liquidity Cockpit.
For everyone else – Please use this link to register your interest in the Liquidity Cockpit.
Oh and one last thing: We’ve been nominated in the A-Team’s TradingTech Insight Awards Europe 2023, in the Best Transaction Cost Analysis (TCA) Tool and the Best Trading Analytics Platform categories. Please vote for us here.


