It would be remiss of us not to comment on some observations on market quality as a result of the macro surprises experienced this year.
There was a lovely correlation between volatility/uncertainty and market quality during 2020. “Lovely” to behold, but unfortunately, expensive for many end investors. It would seem that the market is intended to be fair to all participants but some thrive more in choppy seas.
We see the first evidence of this in Exhibit A today.
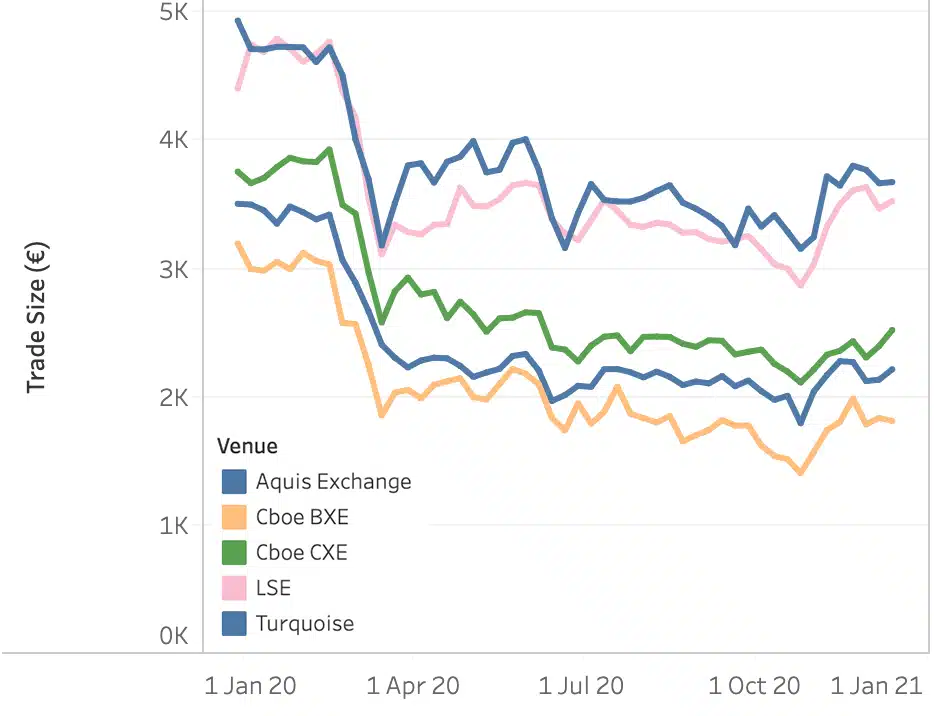
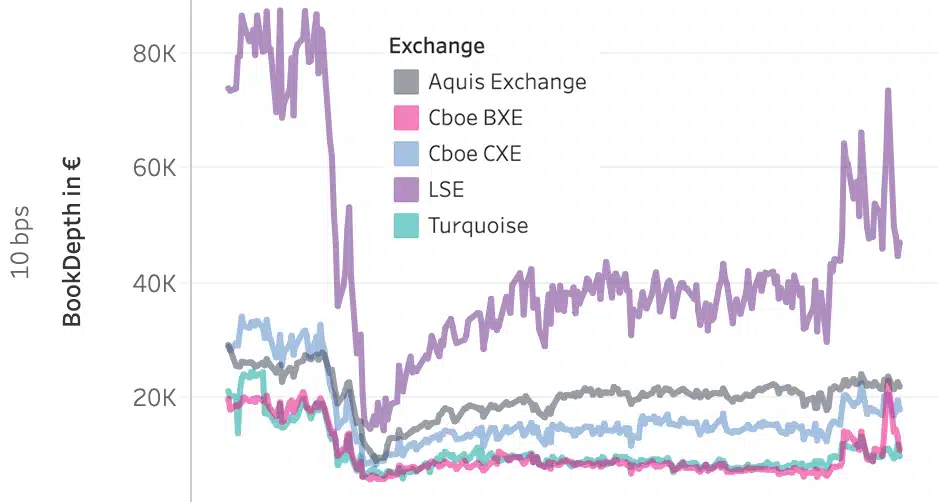
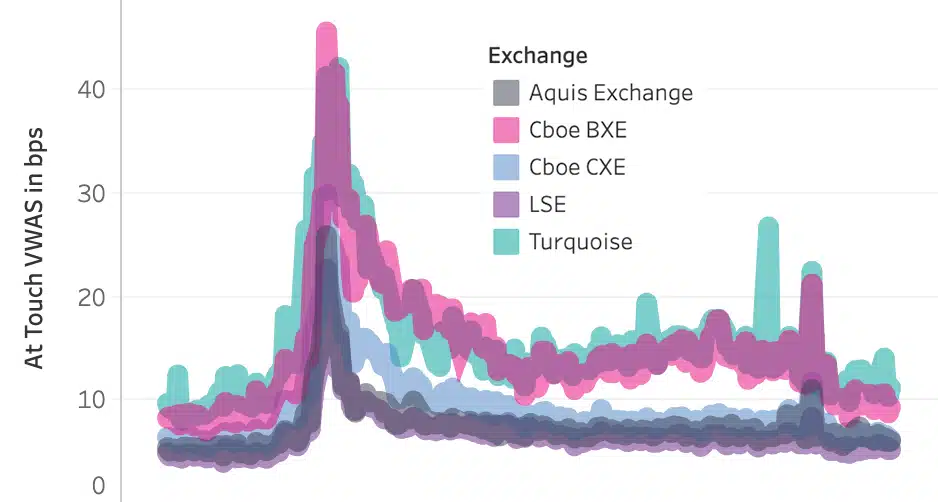
All the charts today show year-to-date trends for UK blue chips across the relevant lit venues to show how implicit costs of trading rose dramatically as turnover exploded at the end of Q1. In all cases we saw the metrics normalising as markets recovered but not back to where they were. In fact, it is only since the news on the same trading day of a US election result, and a vaccine discovery, that market quality began to look as it did before March.
Firstly, average trade size fell across all venues, indicating decreased available liquidity at the touch. So we checked…
…and we saw that confirmed with book depth (in chart two we see book depth available at a spread of 10bps, roughly equivalent to the average UK100 stock touch).
Available liquidity at the touch fell away dramatically, recovered slightly, and is only now approaching pre March levels.
Finally we looked at spreads (time weighted intra day and value weighted over time). Once again the market quality reduced as spreads widened dramatically.
The recovery looks complete but if you drill into the detail (which of course we can) we see that again, the spreads are only back to “normal” in the last month.
For end investors this means higher costs of trading whenever they (or their brokers’ algorithms) crossed the spread, and clearly had to cross the spread more to trade in the size they needed. On the other side of these trades sit the market makers, who love volatility.
George Orwell’s description of the animals lends itself to other scenarios…
*****
Please let us know if you are interested in gaining access to this, or other data.
All the content here has been generated by big xyt’s Liquidity Cockpit dashboards or API.
For existing clients – Log in to the Liquidity Cockpit.
For everyone else – Please use this link to register your interest in the Liquidity Cockpit.
Oh and one last thing: We’ve been nominated in the A-Team’s TradingTech Insight Awards Europe for 2020, in the Best Transaction Cost Analysis (TCA) Tool and the Best Trading Analytics Platform categories. Please vote for us here.


