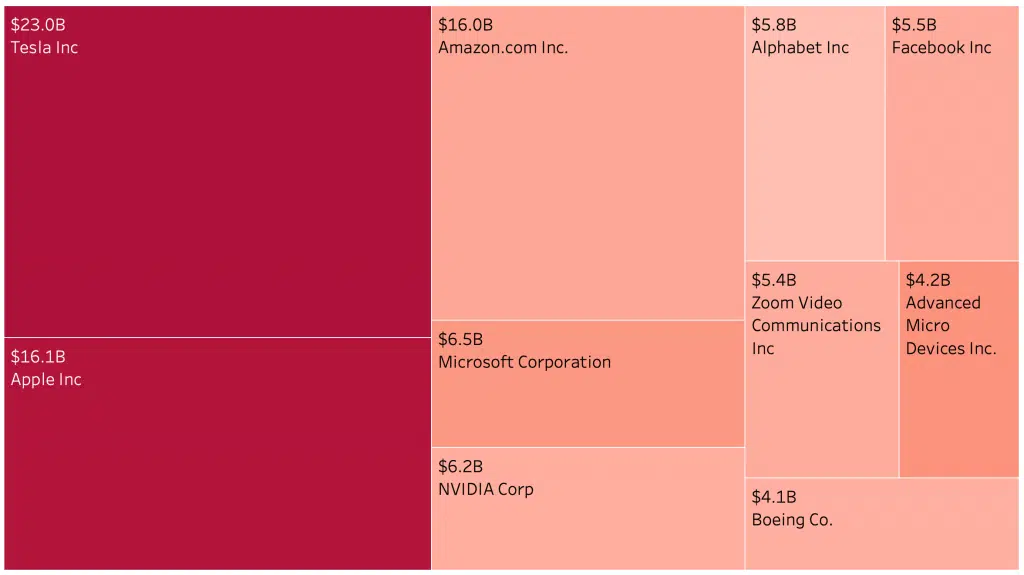
Our image of the 21st Century Santa depicts a carbon neutral delivery of presents from technology-driven sources, prompting the question: Who will be the winner from the festive shopping season this year?
With an ever decreasing number of retailers surviving on the high street, everyone is looking online for stocking fillers and we can expect Amazon to continue to surf this wave.
Some, like Apple, have built their success through customers’ ability to buy direct and there is plenty of evidence that the brand hasn’t lost any of its appeal.
Both companies are listed and are amongst the highest traded stocks by value and trade count. We’ve started tracking this in the US as we broaden our ‘Liquidity Universe’.
One stock, for the moment at least, has a higher trade count and trades more daily value than either of these retail giants: Tesla, the stock market’s new sweetheart.
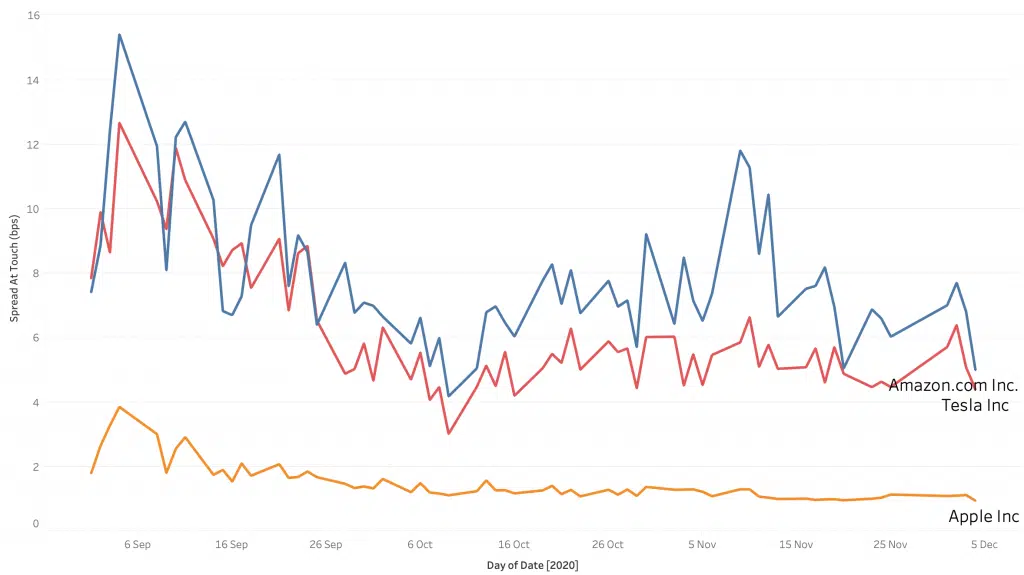
However, we see something a little surprising when we use our big xyt magnifying glass to take a look at spreads (yes, we can do this in the US as well).
This chart looks at the average spread (in basis points) at touch over time for three US stocks with the most activity.
Given the relative difference in share prices, it might seem reasonable that Apple has a consistently tighter spread than Amazon. The average spread for Tesla, despite its phenomenal value turnover and trade count, has been closer to Amazon’s than Apple’s.
Perhaps Mr Musk will be turning to Mr Bezos over a festive glass of sherry and saying “I think it’s the end of your reign, dear”!
Watch this space for further analysis of US market metrics…
*****
Please let us know if you are interested in gaining access to this, or other data.
All the content here has been generated by big xyt’s Liquidity Cockpit dashboards or API.
For existing clients – Log in to the Liquidity Cockpit.
For everyone else – Please use this link to register your interest in the Liquidity Cockpit.
Oh and one last thing: We’ve been nominated in the A-Team’s TradingTech Insight Awards Europe for 2020, in the Best Transaction Cost Analysis (TCA) Tool and the Best Trading Analytics Platform categories. Please vote for us here.


