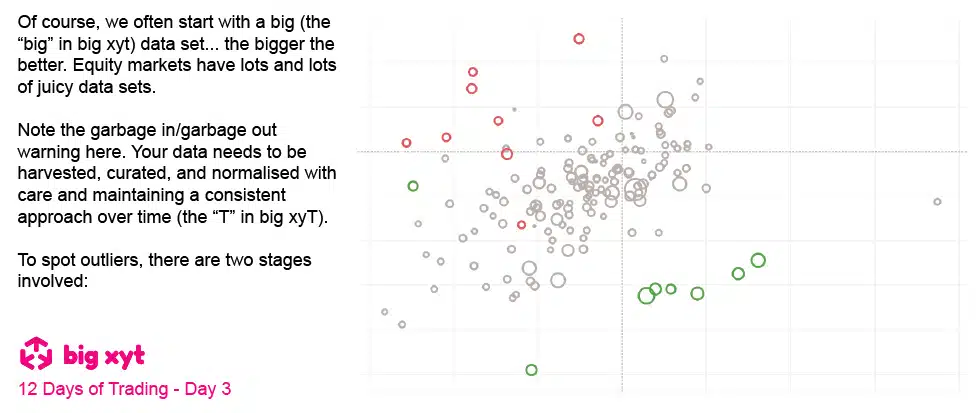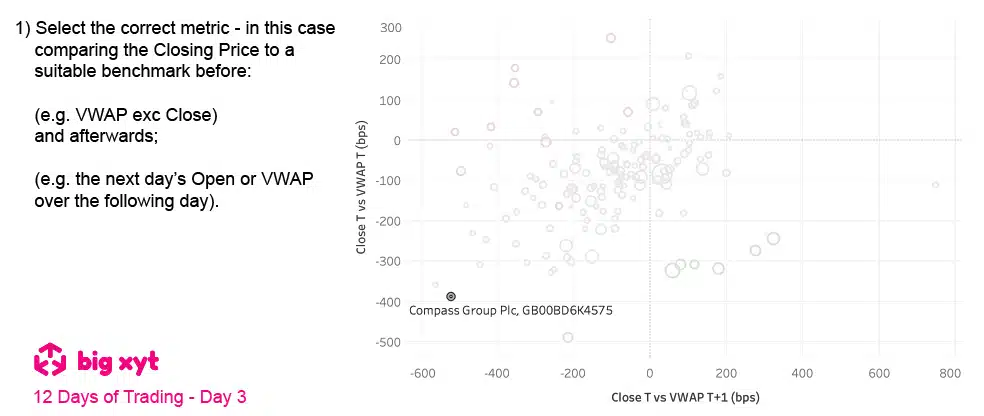
After our first post of this series where we highlighted three stocks with large price reversion before and after the close on 30th November, we had several enquiries asking if we have an easy way to identify these moves.
When using data analytics to support trading decisions, one can try to gain an insight from a snapshot of information to simplify something complex or often, more valuably, to identify a trend or pattern.
Either way it is like a game of I Spy.
Start with a nice big, clean, consistent data set
Choose your measures carefully
Visualisation
If you would like to know more about the tools available to conduct this type of analysis, please get in touch.
All the content here has been generated by big xyt’s Liquidity Cockpit dashboards or API.
For existing clients – Log in to the Liquidity Cockpit.
For everyone else – Please use this link to register your interest in the Liquidity Cockpit.
Oh and one last thing: We’ve been nominated in the A-Team’s TradingTech Insight Awards Europe for 2020, in the Best Transaction Cost Analysis (TCA) Tool and the Best Trading Analytics Platform categories. Please vote for us here.


