It’s been a turbulent year for the airlines, and just as the arrival of vaccines seemed to clear away some of the clouds, they’ve been hit by a blizzard of travel restrictions. In today’s 12 Days of Trading post we look at easyJet, a UK travel sector mid cap stock, as an example of how liquidity analysis can inform trading tactics during times of volatility.
easyJet’s shares seemed to be on a smooth climb out just a few weeks ago before suffering a 13% price drop over the weekend, most of which has been recovered at the time of writing.
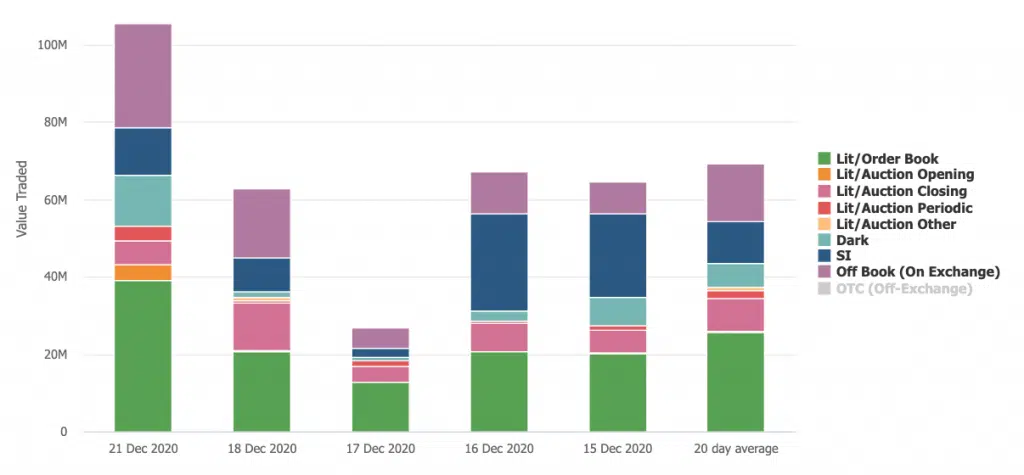
Today’s chart shows the shares’ flightpath over the last few weeks, and puts yesterday’s sell off into context. Sterling value traded increased around 60% over the 20-day average, while spreads also increased by 60% from 9 to 15bps.
We can see the pattern of trading diverging from market norms; 4% traded in the Open (orange) compared with an expected 1.5%, and reflecting the weekend gap, 4% traded in periodic auctions (red) compared with the usual 2.5% and dark trading (light blue) doubled to 12%. On such a busy day, the data tells us to expect more trading on the lit order books, outside of the auctions, but this did not materialise. It seems to have been a day for maximising dark pools and alternative methods such as periodics.
While this event may not grab the headlines as much as say the recent behaviour of Tesla shares, we wanted to show you the importance of keeping an eye on the details. We see time and again that mid cap shares do not follow the average patterns of the market as a whole, perhaps reflecting that there is more manual trading activity in these names especially at times of stress – and we see this in elevated block trading in easyJet yesterday.
In our Single Stock Analytics tool, you can follow the patterns of evolving liquidity at the level of individual shares and on a daily basis. You can use the information to help inform how you execute your trades, especially if you are a significant portion of ADV.
*****
Please let us know if you are interested in gaining access to this, or other data.
All the content here has been generated by big xyt’s Liquidity Cockpit dashboards or API.
For existing clients – Log in to the Liquidity Cockpit.
For everyone else – Please use this link to register your interest in the Liquidity Cockpit.
Oh and one last thing: We’ve been nominated in the A-Team’s TradingTech Insight Awards Europe for 2020, in the Best Transaction Cost Analysis (TCA) Tool and the Best Trading Analytics Platform categories. Please vote for us here.

